The Stanford Bunny
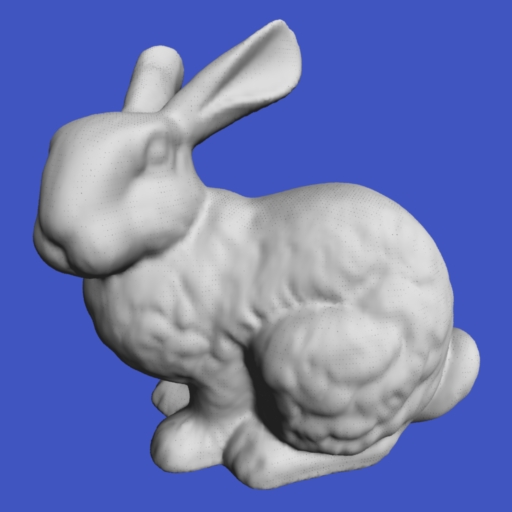
The Stanford Bunny is one of the most commonly used test models in computer
graphics. It is a collection of 69,451 triangles, and it was assembled from
range images of a clay bunny that is roughly 7.5 inches high. Below is a
synthetic rendering of the model, courtesy of Peter Lindstrom. This Web
page describes where the model came from, tells why it was created in the
first place, discusses the relative merits of using it as a test model in
graphics research, and shows some example images.
Range Scanning
The Bunny was created using a technique that I developed together with Marc
Levoy to create polygonal models from several range scans. Our original
paper on this technique is:
- "Zippered Polygon Meshes from Range Images"
- Greg Turk and Marc Levoy
- Siggraph 94, pp. 311-318
-
on-line version of paper available here
Before we talk about the bunny itself, it is worth understanding what range
scans are. A range scan is a grid of distance values that tell how
far the points on a physical object is from the device that creates the
scans (usually known as a range scanner). One way to think of a
range scan is as a 2D image of pixels, but in which each pixel contains a
distance value instead of a color. In fact, one common way to
examine a range image is to draw it as a black-and-white image, with shorter
distances shown as bright pixels and farther distances being darker.
It is usually necessary to piece together several range scans in order
to capture the full geometry of an object.
The particular range scanner that we used for our project was built by a
company called Cyberware. The
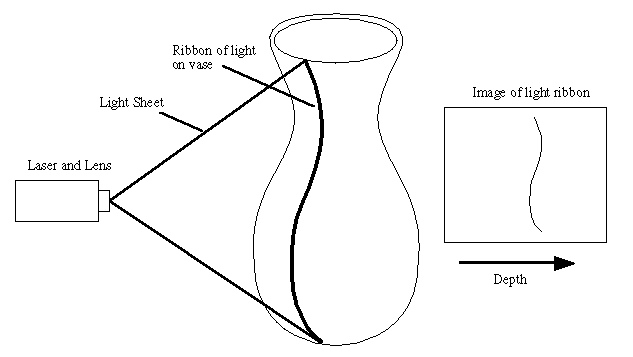
technique that the Cyberware scanner uses to make a range image is to move
an object through a sheet of bright red laser light. The sheet of laser
light is created by sending a laser beam through a cylindrical lens.
Below is a schematic diagram of a scanner. A video camera (not shown in
diagram) observes the object as it passes through the sheet of light, and
this camera is tuned to the particular wavelength of light from the laser.
The camera sees a ribbon of light that wiggles as the object (such as a vase
or a bunny) moves through the sheet of laser light. One such image from the
camera is drawn at the right in the figure below. The range scanner
examines one row of pixels in such an image, and the position of the
brightest part of the ribbon gives a measure of distance (or depth)
of the object from the source of laser light. One such depth value is
placed at grid position in a range image. A single image from the camera
yields a column of range image distance values, and putting together all
such columns (as the object moves throught the light) gives a complete range
image.
It is important to note that in order for an object to be visible to the
camera of the range scanner, its surface must reflect the red laser light.
A black object cannot be scanned, and even a bright blue or green object may
not scan well if it reflects little in the red wavelengths. In addition,
objects that are very shiny (specular) will sometimes cause parts of
an object to be indirectly illuminated through reflection, and this results
in false depth readings. For this reason, I was on the lookout for objects
to scan that reflected red light well and that were diffuse (non-shiny). In
addition, I knew the limitations of our current algorithm in terms of the
geometric complexity of the models that we could work with. I wanted to
find objects that were fairly smooth and that did not have a whole lot of
intricate folds and holes.
Bunny Origin
I was a postdoc at Stanford University with Marc Levoy in 1993 and 1994.
One day, close to the Easter holiday, I was out shopping on University
Avenue near the Stanford campus. I entered a shop that sold various
decorative items for the home and garden. On one of the shelves of the
store was a large collection of clay bunny rabbits, all identical. I had
range scanning on my mind, and these bunnies looked to be about the right
shape and size for our scanning project. Even better, these bunnies were
made of terra cotta (red clay), so they were red and diffuse. I bought one
of these bunnies. Had I known how popular the digital model would become, I
would have bought many! I brought this clay bunny back to the Stanford
Graphics Lab and scanned it from several directions. Using the methods that
Marc and I developed, I aligned a collection of ten such range scans to one
another and merged them into a single polygonal mesh. The resulting model
has come to be known as the Stanford Bunny. The original bunny still lives
at Stanford.
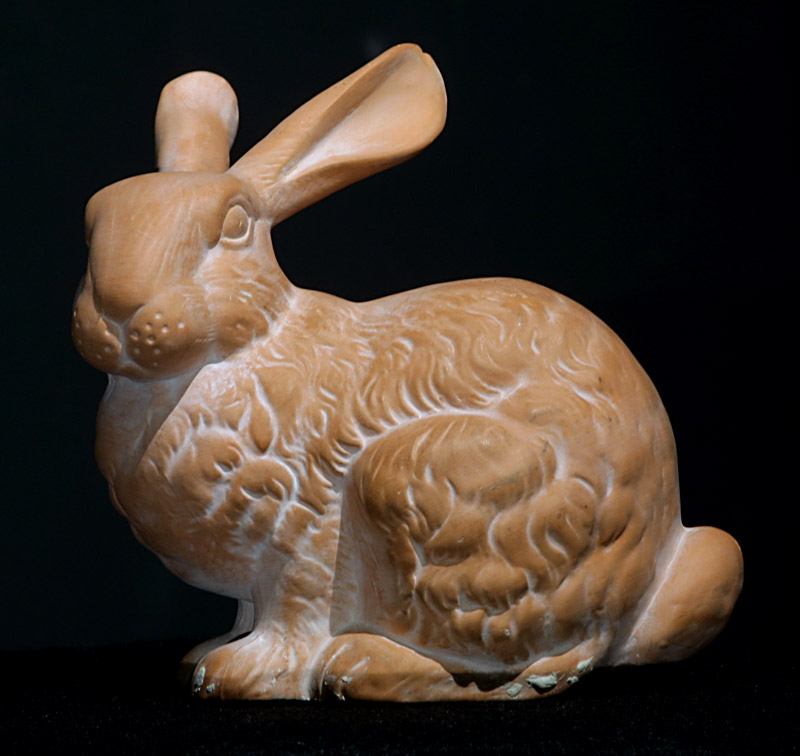
Below is a color image of the original bunny, courtesy of Marc Levoy.
Research Bunny
As mentioned above, the Stanford Bunny has been used extensively as
a test model for various research projects in computer graphics. Topics
of some of the research articles that use the bunny include polygonal
simplification, compression, surface smoothing, non-photorealistic
rendering, and texture mapping. But is it really a good idea to use the
bunny for graphics research? I actually consider the bunny to be too
good as a test model. It is fairly smooth, it has manifold
connectivity, and it isn't too complex (69,451 triangles is small by today's
standards). The bunny is so smooth that there is a lot of redundant
information in the original collection of triangles, so simplification and
compression algorithms give wonderful results. I bought the original bunny
in part because it was not complex geometrically. About the only bad
thing about the model is that there are five holes in it. Three of these
holes (one under the chin and two on the base) result from not having scans
to cover these locations, and two holes in the base are really there in the
original clay model -- the bunny is hollow.
My opinion is that the bunny makes a nice object to start with, but one
should also use more difficult models to really challenge one's algorithms.
Here are some places to look for larger models:
It was Marc Levoy's idea to make the original bunny model publically
available, and the first of the Web sites above is the original
distribution site. Recently, Marc and his students spent a year in Italy
scanning the statues of Michelangelo, and some of the models from this
project are at their site, listed above. At least part of the motivation
for this recent project of Marc's is to make available to the graphics
community more challenging models than the bunny.
Bunny Images
Even though I have suggested that researchers shouldn't use the bunny too
much, I cannot resist including some of my favorite bunny pictures from
various research papers. Below are some of the more entertaining images of
the bunny, along with pointers to the papers in which they appear.
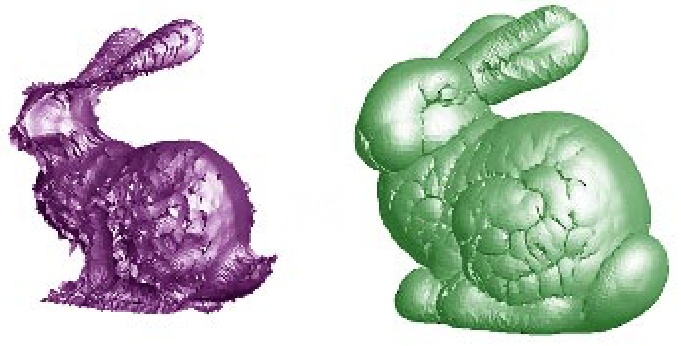
- "Simplification Envelopes"
- Jonathan Cohen, Amitabh Varshney, Dinesh Manocha, Greg Turk, Hans Weber,
- Pankaj Agarwal, Frederick Brooks, William Wright
- Siggraph 1996, pp. 119-128
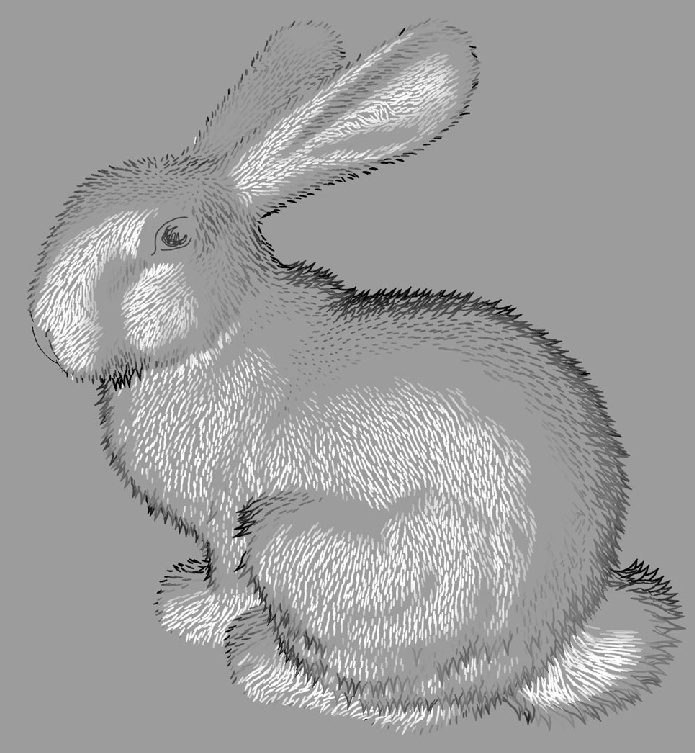
- "Art-Based Rendering of Fur, Grass and Trees"
- Michael A. Kowalski, Lee Markosian, J.D. Northrup, Lubomir Bourdev,
- Ronen Barzel, Loring S. Holden and John F. Hughes
- Siggraph 1999, pp. 433-438
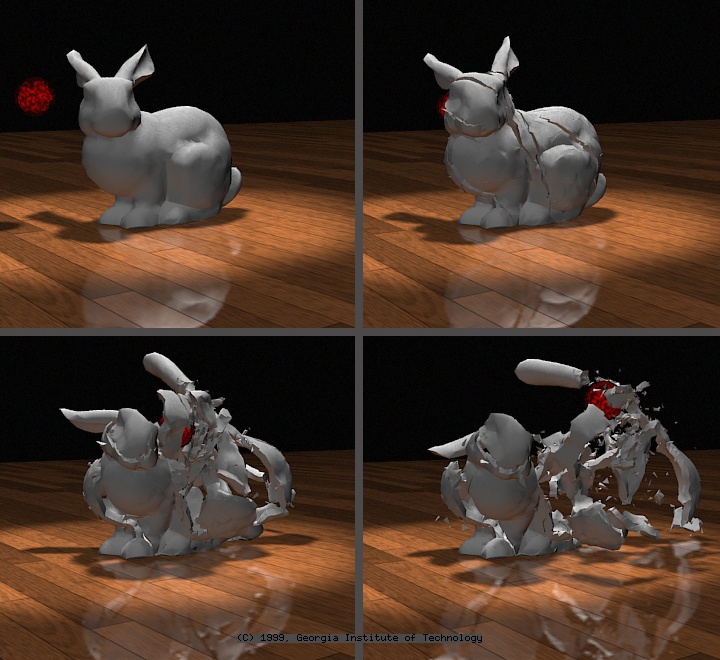
- Image appears in
- "Animating Fracture"
- James F. O'Brien and Jessica K. Hodgins
- Communications of the ACM
- Vol. 43, No. 7, July 2000
- Algorithm published in
- "Graphical Modeling and Animation of Brittle Fracture"
- James F. O'Brien and Jessica K. Hodgins
- Siggraph 1999, pp. 137-146
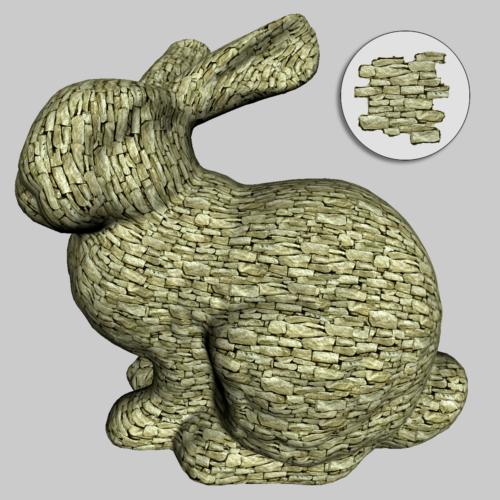
- "Lapped Textures"
- Emil Praun, Adam Finkelstein, and Hugues Hoppe
- Siggraph 2000, pp. 465-470
- (This image also appears on the proceedings cover.)
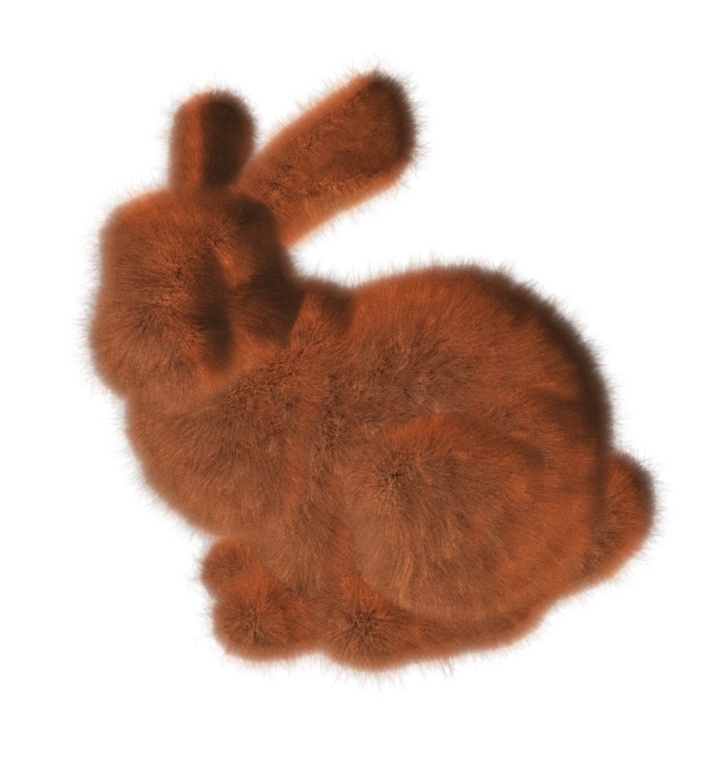
- "Real-Time Fur over Arbitrary Surfaces"
- Jed Lengyel, Emil Praun, Adam Finkelstein, and Hugues Hoppe
- ACM Symposium on Interactive 3D Graphics
- Research Triangle Park, North Carolina, 2001
- pp. 227-232
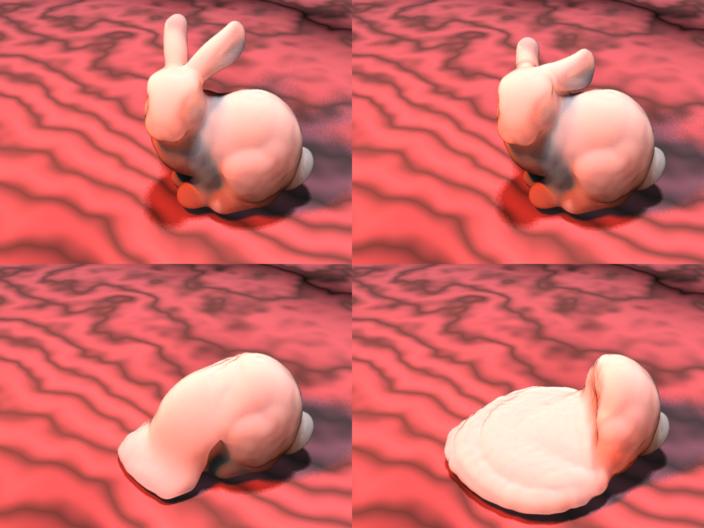
- "Melting and Flowing"
- Mark Carlson, Peter Mucha, Brooks Van Horn III, and Greg Turk
- ACM Symposium on Computer Animation
- San Antonoi, Texas, July 21-22
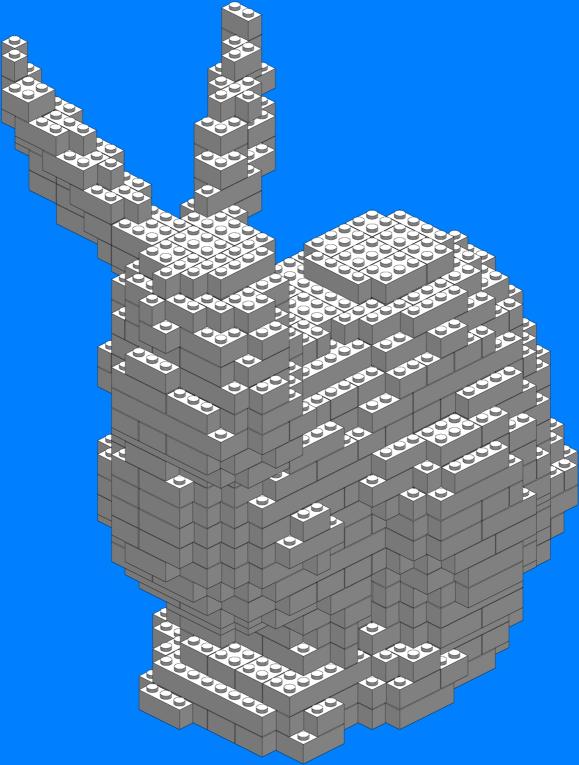
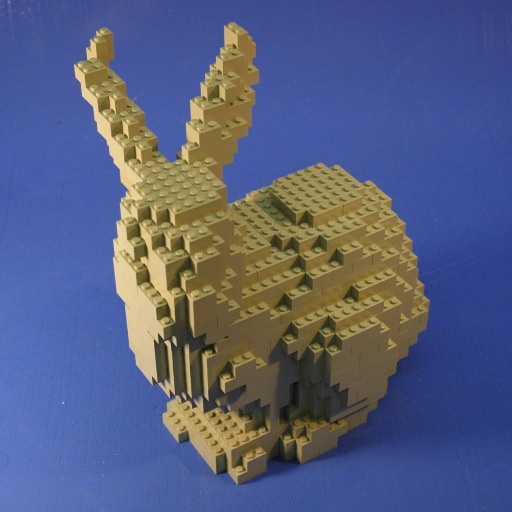
Lego bunny (pattern and photo). Design by Andrew P. Van Pernis of Clemson University.
This page was written by
Greg Turk
, August 2000.


