Due Friday October 27th, 12 Noon
CS 4460 - Information Visualization - Fall 2017
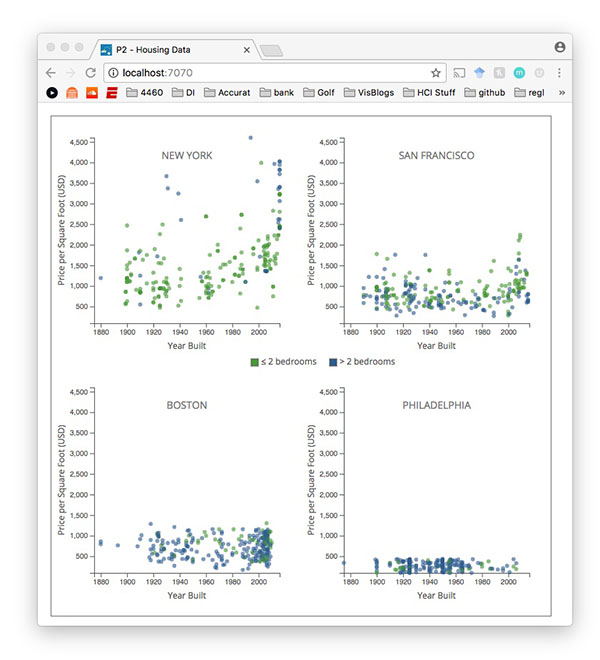
In this assignment you will create a trellis scatterplot. The trellis display consists of 4 charts, each showing real estate data for 4 cities. Your submission should create a web page that looks like this:

You will use the dataset at ./data/real_estate.csv to create the trellis display. Here is a snippet of the dataset:
location |
beds |
bath |
price |
year_built |
sqft |
price_per_sqft |
|---|---|---|---|---|---|---|
| New York | 2 | 1 | 999000 | 1960 | 1000 | 999 |
| New York | 2 | 2 | 2749502 | 2006 | 1418 | 1939 |
| San Francisco | 2 | 1 | 875448 | 1908 | 1158 | 756 |
| Boston | 3 | 2 | 1605468 | 1911 | 1588 | 1011 |
| Boston | 3 | 2 | 1514496 | 1924 | 1536 | 986 |
For those interested, the NY & SF portion of this dataset comes from the r2d3 - A visual introduction to machine learning storytelling visualization. Take a look, the authors use beautiful animations and transitions to explain ML classification.
Back to the matter at hand - you will use this dataset to create the above trellis scatterplot. First, you will need to group or nest the dataset by the location data attribute [San Francisco, New York, Boston, Philadelphia]. Like in P1, you will need to re-configure the data for the location data attribute.
For this assignment, you are required to accomplish this with the d3.nest() function. Hopefully, you mastered it last week in P1 and during Lab 5.
Then you will need to create each 4 trellis plots and lay them out in a uniform way. Look to Lab 5 where we covered how to accomplish nested selections and grouping.
Reminder that this is an individual assignment. The code you turn in should be your own creation. You are certainly welcome to seek assistance from the TAs as you work on the assignment, however.
All of the starter code for the Programming Assignments can be found at the HW Github Repository. git clone this repository for this assignments starter code. You will need to git pull for all future starter code.
You are required to use the starter code for all programming assignments.
You will submit your code via T-Square. Compress your code (the 01_bar_chart directory) into a zip file. Upload and submit this zip file via T-Square.
Your zipped code should be submitted to T-Square by 12 Noon on Friday October 27th
This assignment will be graded out of a 100 point scale. If your D3 code does all of the following you will receive all 100 points:
d3.nest() is required to accomplish this - you will lose points if you do not use d3.nest().You will not lose points on any of the following:
./data/real_estate.csvExtra Credit
We will be giving up to 10 points of extra credit for styling your charts. Or any useful feature that enhances your visualization. Please make note of the additions/embellishments in the notes of your T-Square submission.