Due Friday, November 3rd, 12 Noon
CS 4460 - Information Visualization - Fall 2017
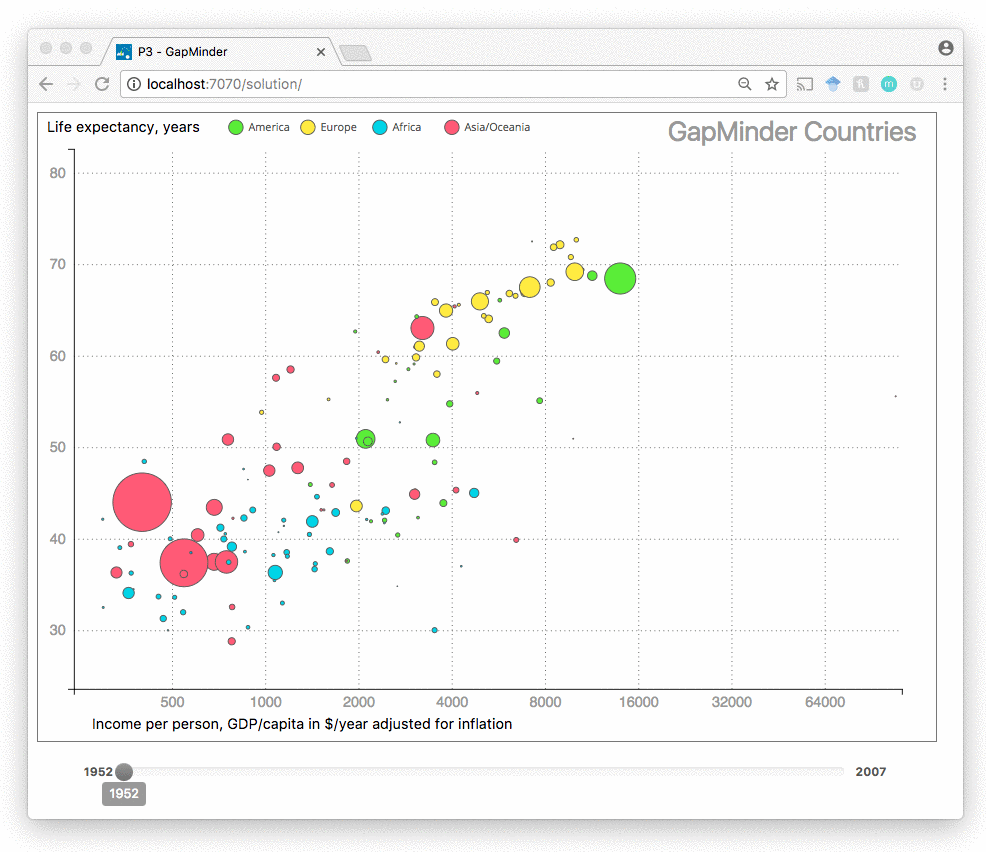
In this assignment you will create a version of the bubble chart from Hans Rosling's GapMinder storytelling video. The bubble chart shows 142 countries. The chart shows the life expectancy compared to the GDP per capita for each country. An interactive version of the tool can be found on the GapMinder website.
Your chart will be interactive. It must update to show the data for each 5-year interval. We have already added a slider that will control the current year for the chart. Your submission should update with the slider as seen below:
The slider will call the method updateChart(year) where year is one of the 5-year intervals from the dataset. It is your job to update your chart within this method.
You will use the dataset at ./data/gapminder.csv to re-create the GapMinder bubble chart. Here is a snippet of the dataset:
country |
year |
population |
continent |
lifeExp |
gdpPercap |
|---|---|---|---|---|---|
| Afghanistan | 2002 | 25268405 | Asia | 42.129 | 726.7340548 |
| Afghanistan | 2007 | 31889923 | Asia | 43.828 | 974.5803384 |
| United Kingdom | 1977 | 56179000 | Europe | 72.76 | 17428.74846 |
| United Kingdom | 1982 | 56339704 | Europe | 74.04 | 18232.42452 |
| Madagascar | 2002 | 16473477 | Africa | 57.286 | 894.6370822 |
| Madagascar | 2007 | 19167654 | Africa | 59.443 | 894.6370822 |
country (string) - the name of the countryyear (number) - the year for that recording, spans from 1952 to 2007 in 5-year intervalspopulation (number) - the total population for that yearlifeExp (number) - the mean life expectancy for that yeargdpPercap (number) - the income per person, or GDP per capita in USD adjusted for inflation for that year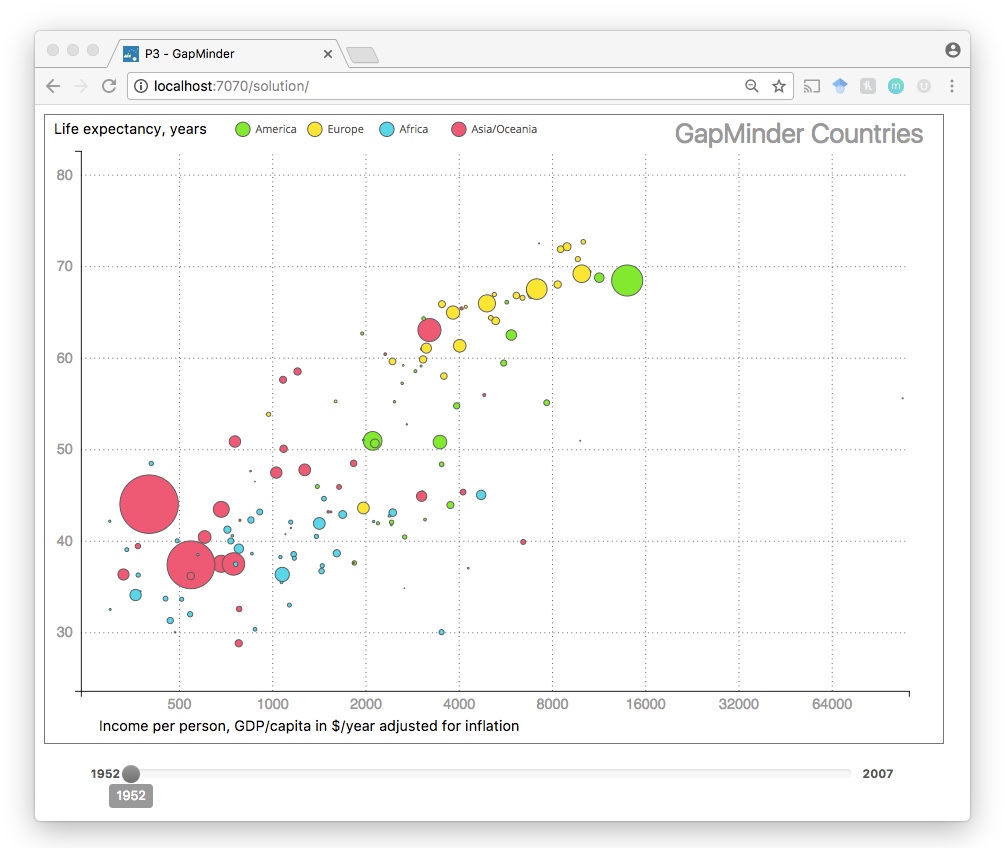
You will use this dataset to create the above interactive bubble chart.
The data-bindings on the bubbles are:
gdpPercap in a scaleLoglifeExp in a scaleLinearpopulation in a scaleSqrtcontinent (we have provided the color map as contintentColors)First, you will need to group or nest the dataset by the year data attribute. This data re-configuration is slightly different - you want to access all 142 countries for each year so making a key-value array with d3.nest().entries() might not be the best method.
Unlike P2 you are not required to use the d3.nest() function.
You will create this interactive chart using D3's Enter, Update, Exit pattern. Look to Lab 6 where we covered how to add, update, and remove elements with D3.
Reminder that this is an individual assignment. The code you turn in should be your own creation. You are certainly welcome to seek assistance from the TAs as you work on the assignment, however.
All of the starter code for the Programming Assignments can be found at the HW Github Repository. git clone this repository for this assignments starter code. You will need to git pull for all future starter code.
You are required to use the starter code for all programming assignments.
You will submit your code via T-Square. Compress your code (the 03_gapminder directory) into a zip file. Upload and submit this zip file via T-Square.
Your zipped code should be submitted to T-Square by 12 Noon on Friday, November 3rd
This assignment will be graded out of a 100 point scale. If your D3 code does all of the following you will receive all 100 points:
updateChart(year). You are required to use the Enter, Update, Exit D3 pattern. Points will be deducted if your code removes all circles and then re-appends new circles on every updateChart() call. Your code should use object constancy per country.You will not lose points on any of the following:
./data/gapminder.csvExtra Credit
We will be giving up to 10 points of extra credit for styling your charts. Or any useful feature that enhances your visualization. Please make note of the additions/embellishments in the notes of your T-Square submission.