Due Wednesday, November 15th, 12 Noon
CS 4460 - Information Visualization - Fall 2017
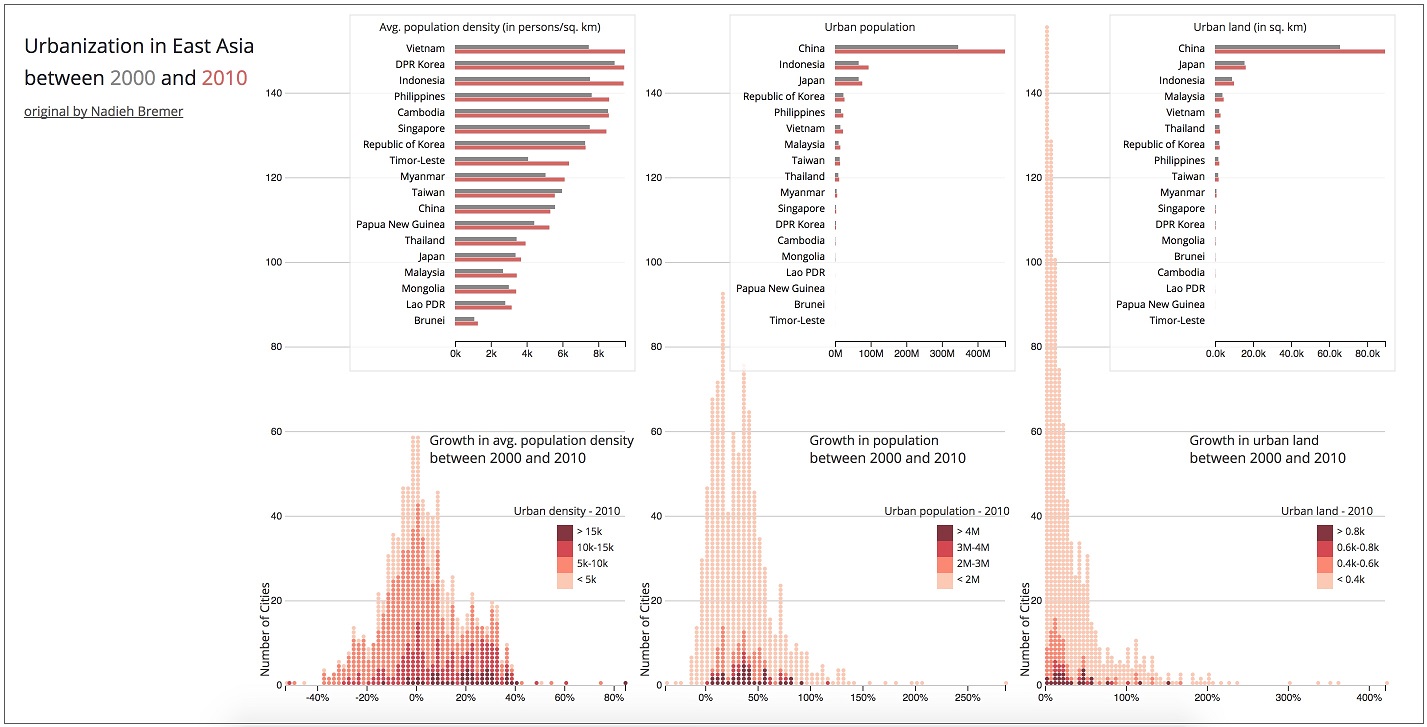
In this assignment you will create a version of the charts from Nadieh Bremer's Urbanization in East Asia narrative visualization. We highly recommend going through this visualization as a great example of storytelling and to learn more about the dataset.
In this assignment you will create multiple coordinated charts. You will create 6 total subplots. Your submission should include a bar chart and a dot histogram for each of the following urbanization measures:
The bar charts should compare the 2000 and 2010 metrics for each country. While the histograms should show the distribution of the percent growth for each city (Note: percent growth is already calculated for all three metrics). Your final chart will look like this:
Your subplots will also need to support coordinated interactions for brushing and linking. First, your dot histogram charts will have brushing in the x-direction. The brush will highlight the selected cities from that histogram in the other 2 histograms. Note that only one brush can be active at a time, so you will have to save the state of the active brush. The interaction should look like this:
Next, your submission should include linking from the bar charts to the histogram plots. Since the bar charts display all of the East Asian countries, you will use mouseover and mouseout events (aka hovering) to trigger a linked highlighting in all other views. The dots in the histogram should be highlighted if they are the same country, and the grouped bars of that country in the other 2 bar charts should be highlighted as well. The interaction should look like this:

You will use the dataset at ./data/asia_urbanization.csv to re-create the Urbanization in East Asia interactive visualization. Use the above relative path when calling d3.csv(). We will deduct 2 points if you do not use a proper relative path.
Here is a snippet of the dataset:
| city | country | latitude | longitude | land_2000 | land_2010 | land_growth | pop_2000 | pop_2010 | pop_growth | density_2000 | density_2010 | density_growth | type_country |
|---|---|---|---|---|---|---|---|---|---|---|---|---|---|
| Tokyo | Japan | 35.7090259 | 139.7319925 | 5434 | 5570 | 0.025 | 27695526 | 31788261 | 0.148 | 5097 | 5707 | 0.12 | high-income |
| Jakarta | Indonesia | -6.2087634 | 106.845599 | 1338 | 1600 | 0.196 | 16291976 | 23431674 | 0.438 | 12174 | 14643 | 0.203 | lower-middle-income |
| Beijing | China | 39.904211 | 116.407395 | 1827 | 2716 | 0.487 | 10754014 | 16707094 | 0.554 | 5887 | 6151 | 0.045 | upper-middle-income |
| Seoul | Republic of Korea | 37.566535 | 126.9779692 | 1067 | 1192 | 0.117 | 14277211 | 15898238 | 0.114 | 13378 | 13342 | -0.003 | high-income |
| Bangkok | Thailand | 13.7563309 | 100.5017651 | 1910 | 2126 | 0.113 | 7825880 | 9555372 | 0.221 | 4098 | 4495 | 0.097 | upper-middle-income |
city (string) - the name of the urban citycountry (string) - the name of the countryland_2000 (number) - the recorded land in 2000 (sq. km)land_2010 (number) - the recorded land in 2010 (sq. km)land_growth (number) - the percent growth in land between 2000 and 2010pop_2000 (number) - the recorded population in 2000pop_2010 (number) - the recorded population in 2010pop_growth (number) - the percent growth in population between 2000 and 2010density_2000 (number) - the recorded population density in 2000 (persons per sq. km)density_2010 (number) - the recorded population in 2010 (persons per sq. km)density_growth (number) - the percent growth in population density between 2000 and 2010You will use this dataset to create the above multiple coordinated plots.
The data-bindings on the grouped bar charts are:
land & population | mean of density] in a scaleLinearThe data-bindings on the dot histograms are:
growth measure - recommend using d3.histogram to calculate intermediate layout dataset (hint: use xScale.ticks(80) to compute the histogram's thresholds() like they do in this example)scaleQuantize2010 value in y-directionYou will need to re-configure the dataset two different ways:
d3.nest() to compute an aggregated dataset for each country. You will compute the sum for land and population, and the mean for density.land_growth, pop_growth, density_growth. As mentioned above to get good binning use xScale.ticks(80) to compute the histogram's thresholds() like they do in this example. Where xScale is a scaleLinear function that maps the input domain of the growth measure to the width of the histogram.You will create this interactive chart using D3's Brush tool. We will cover how to create brushing in Lab 8, so stay tuned. In the mean time, take a look at these examples for how to add brushing:
Reminder that this is an individual assignment. The code you turn in should be your own creation. You are certainly welcome to seek assistance from the TAs as you work on the assignment, however.
All of the starter code for the Programming Assignments can be found at the HW Github Repository. git clone this repository for this assignments starter code. You will need to git pull for all future starter code.
You are required to use the starter code for all programming assignments.
You will submit your code via T-Square. Compress your code (the 04_brush_and_link directory) into a zip file. Upload and submit this zip file via T-Square.
Your zipped code should be submitted to T-Square by 12 Noon on Wednesday, November 15th
This assignment will be graded out of a 100 point scale. If your D3 code does all of the following you will receive all 100 points:
You will not lose points on any of the following:
./data/asia_urbanization.csvExtra Credit
We will be giving up to 10 points of extra credit for styling your charts. Or any useful feature that enhances your visualization. Please make note of the additions/embellishments in the notes of your T-Square submission.