Pinellas County, Florida · Hurricanes Helene and Milton, 2024
Two storms, one metre
Helene pushed the Gulf into the streets on 26 September 2024. Two weeks later Milton dropped fourteen inches of rain on St. Petersburg. A flood simulation of the whole county on a one-metre grid, with every building in it, shows where the water went.
↔
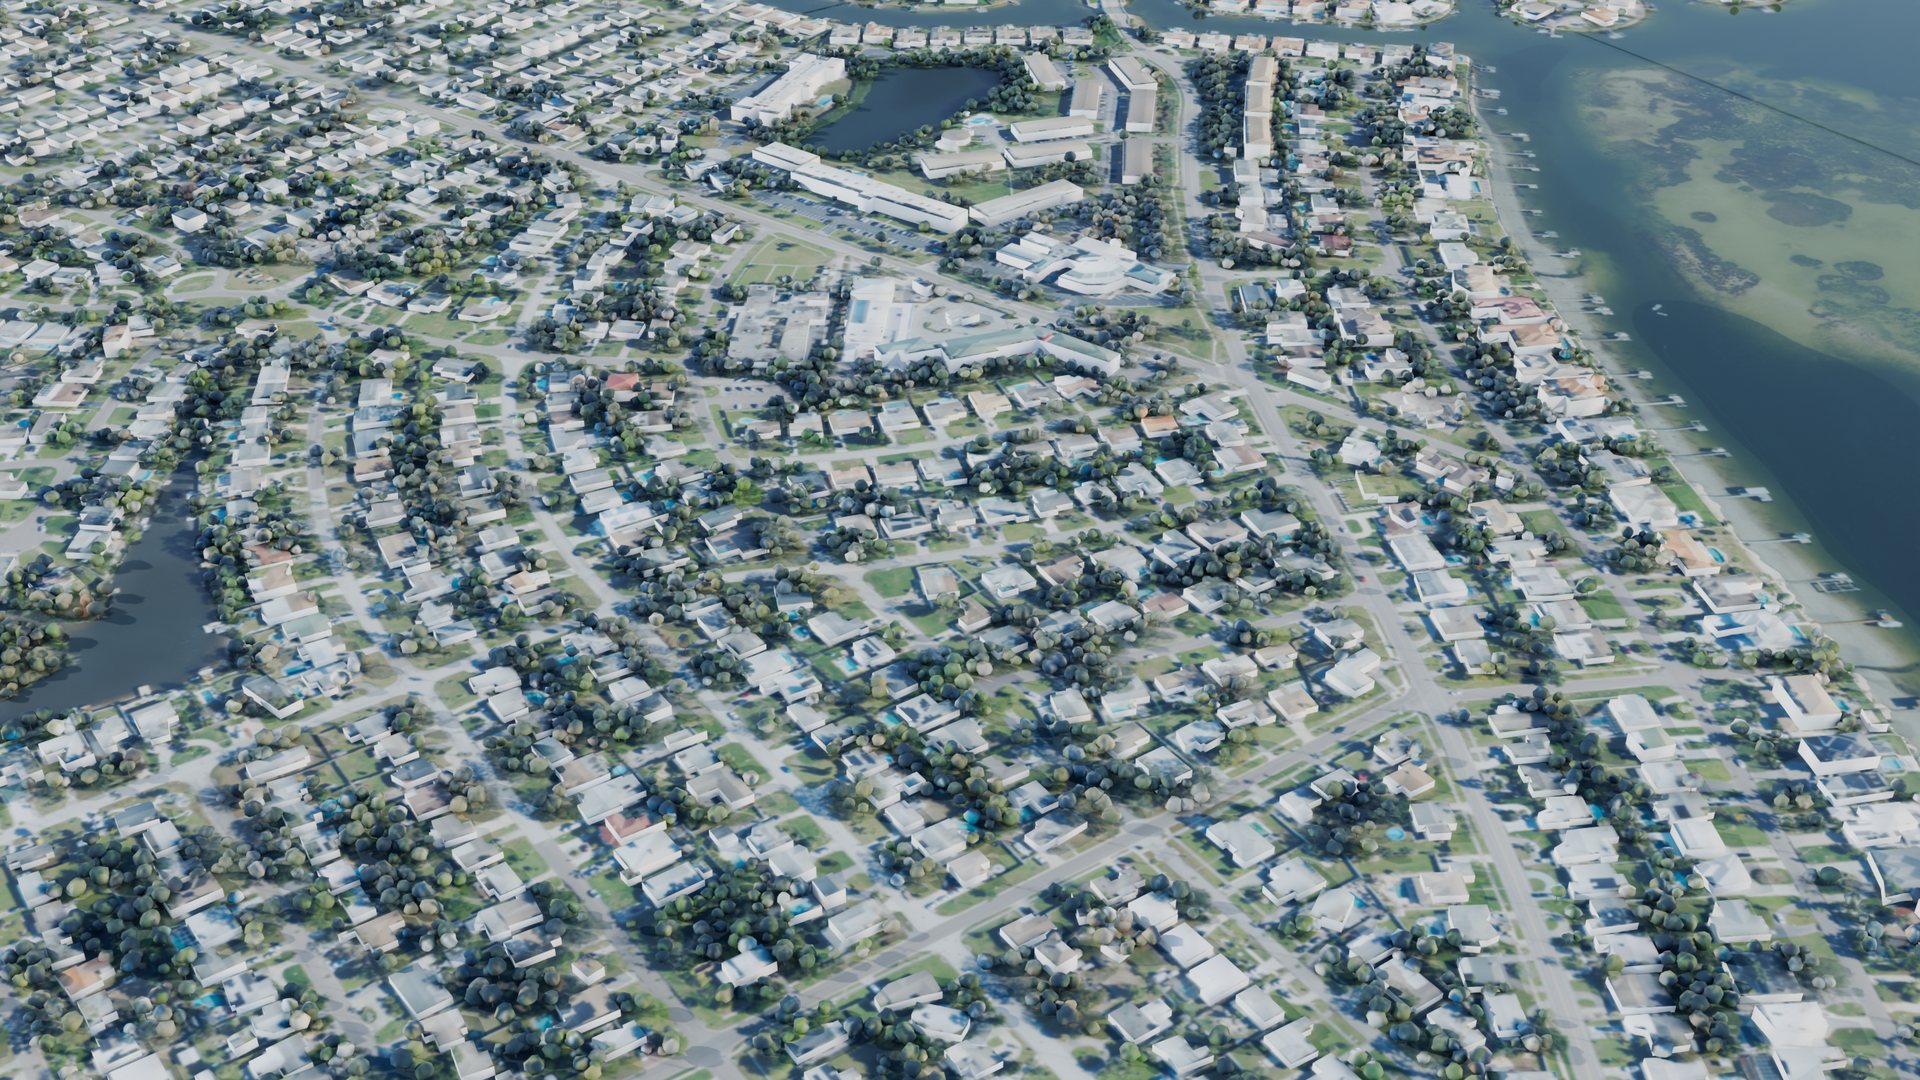
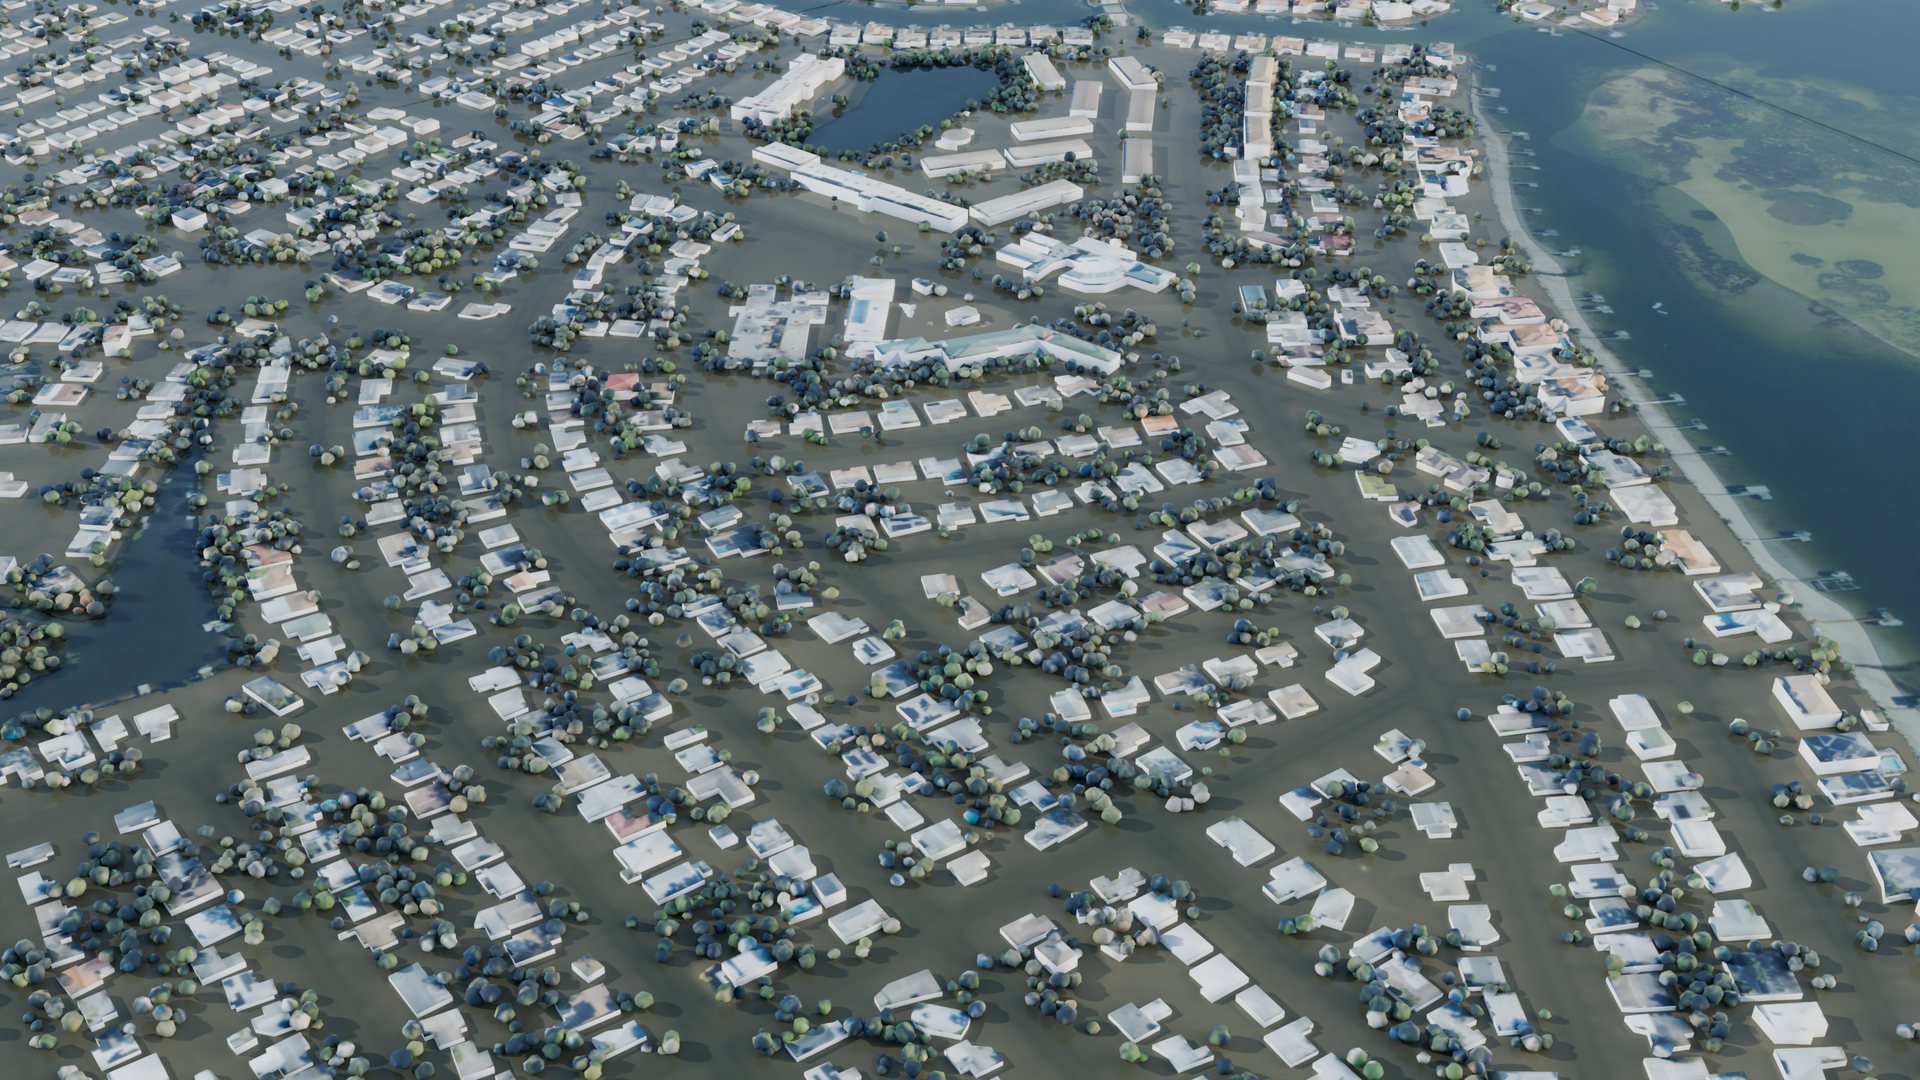
BeforeHelene, 04:45 UTC
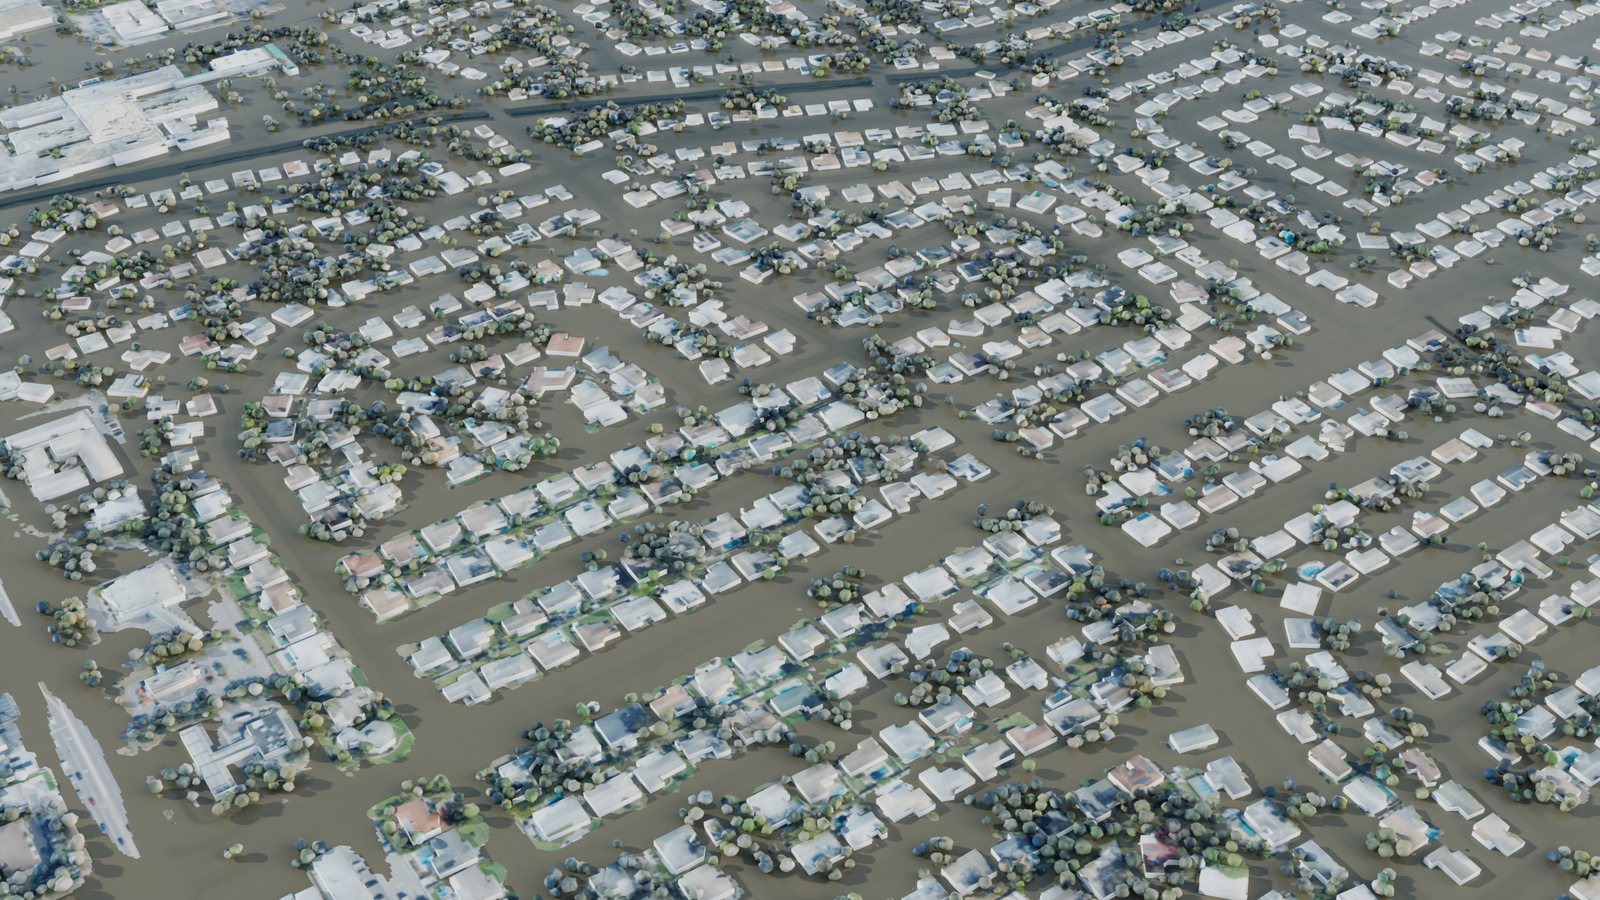
Shore Acres, northeast St. Petersburg, before Helene and at the height of its surge in the simulation (27 Sep 2024, 04:45 UTC). Every block is a mapped building; the ground carries the 2023 aerial photo. Drawn in daylight so it can be seen; the surge peaked near midnight local time.
Helene · storm surge
26–27 Sep 2024 · Gulf and bay water pushed ashore
59,130
buildings in Pinellas with at least 15 cm of water against their walls
13,273
of them with a metre or more
84km²
of normally dry land under at least 15 cm
2.32m
peak at the Clearwater Beach gauge (NAVD88), a record there
Milton · extreme rain
9–10 Oct 2024 · rain on the land, while the bay drained away
76,745
buildings in Pinellas with at least 15 cm of water against their walls
2,605
of them with a metre or more
107km²
of normally dry land under at least 15 cm
366mm
of rain over St. Petersburg in the run's 20 hours (radar, gauge-corrected)
“Water against the walls” is the deepest water in the cells touching a building’s footprint. It is not the water inside: floor heights are not in the data.
Explore it in 3D
Pick a place, drag to turn it, scroll or pinch to zoom, and play the storm. In photo mode the flood is muddy water over the 2023 aerial photo. In impact mode the flood is blue by depth and each building takes the colour of the deepest water at its walls.
Loading the scene…
Place
View
Time
–
Flood depth on land
0.10.51.01.52 m
Water at the walls
0.150.50.91.31.65 m
Two kinds of flood
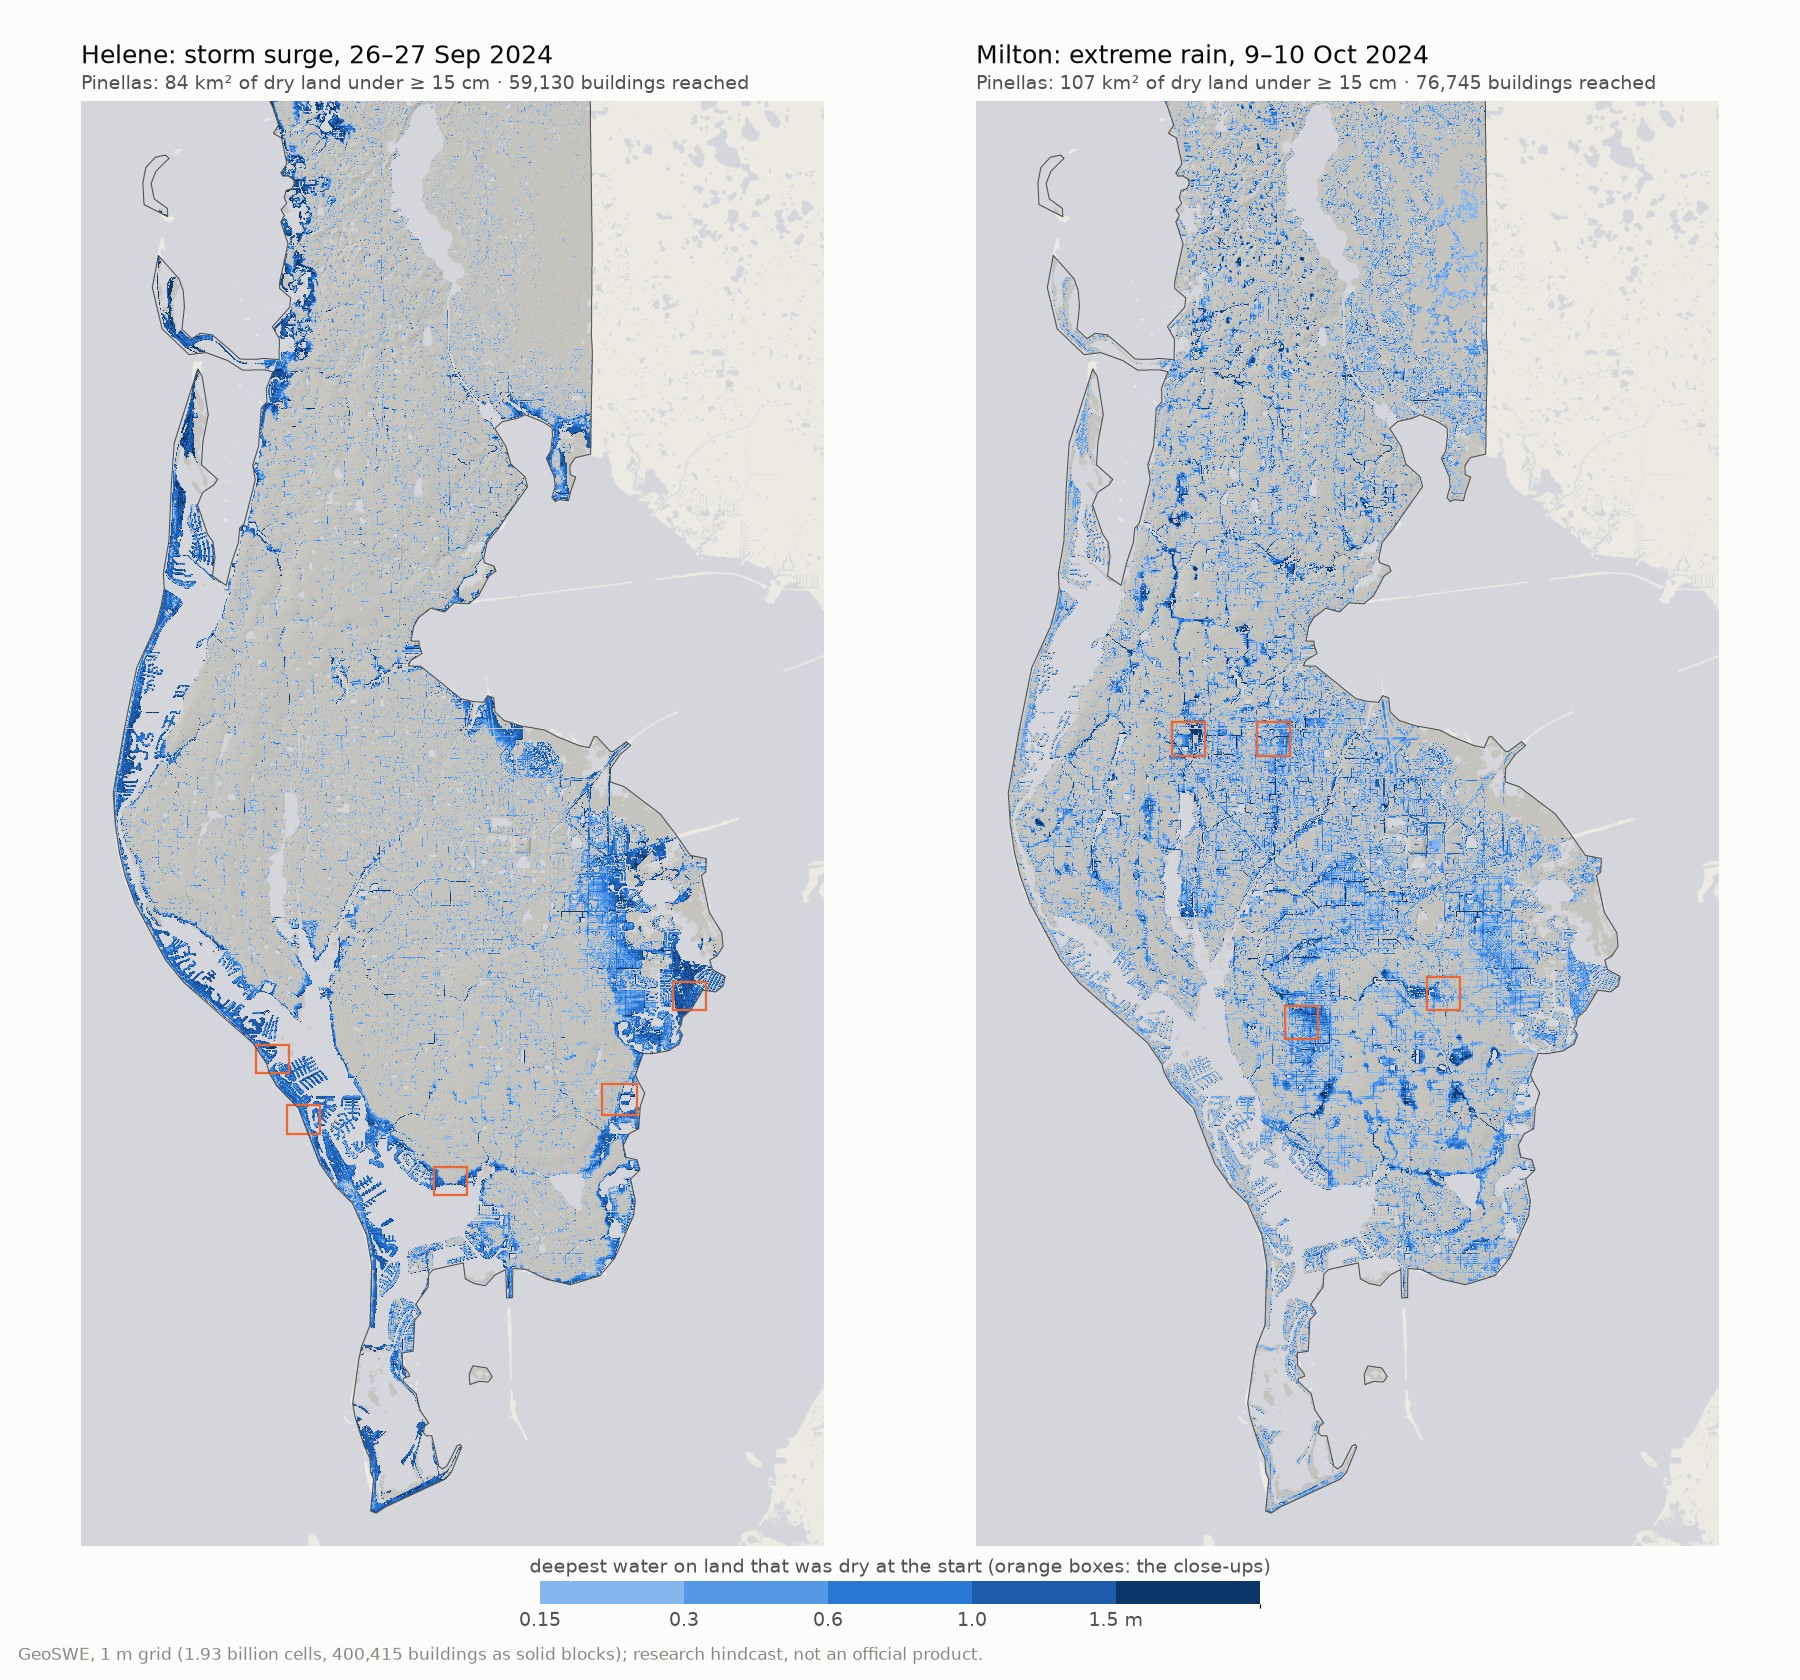
Helene stayed offshore, but its winds held the Gulf and Tampa Bay about two metres above the land datum (NAVD88) through the night. The water came over the beaches, the seawalls and the canal banks. The damage is a ribbon along the shore: the barrier islands, the back-bay neighbourhoods, and northeast St. Petersburg.
Milton came ashore south of Tampa Bay and its winds pushed water out of the bay instead: the gauge at Old Port Tampa fell to 0.8 m below the datum. Its rain fell everywhere, up to 64 mm in one hour over St. Petersburg, and gathered in the low ground along creeks and ditches far from the coast. More buildings were reached, but the water was shallower: a median of 28 cm at the walls, against 60 cm in Helene.
Deepest water on land that was dry when each run began, Pinellas County only; wetlands and open water left out. Orange boxes mark the close-ups below.
Close up
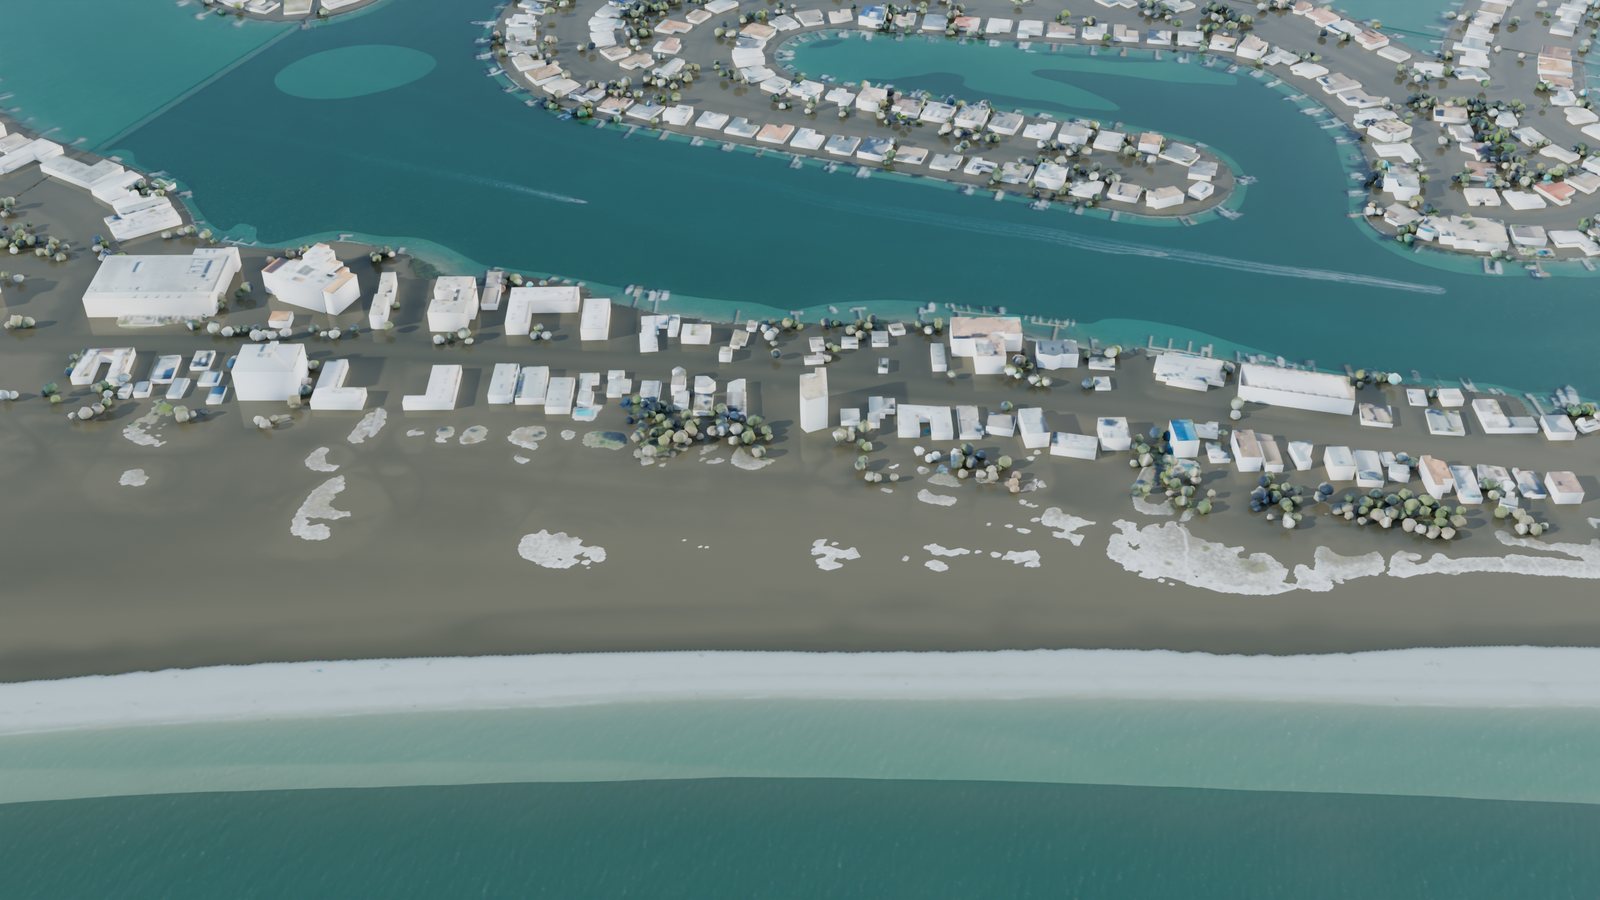
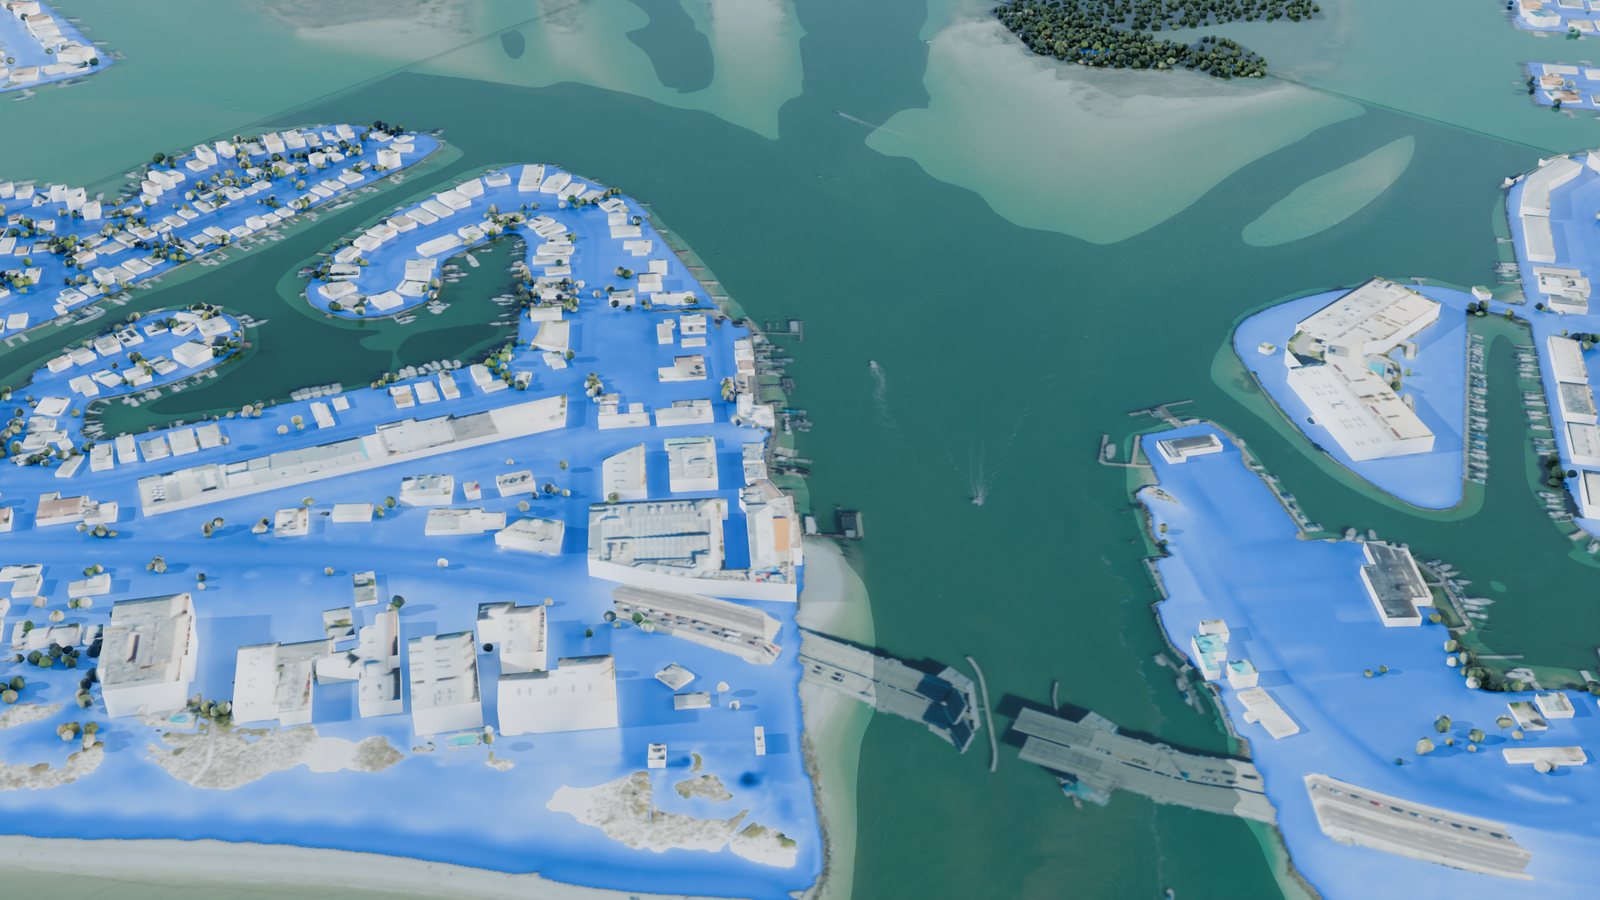
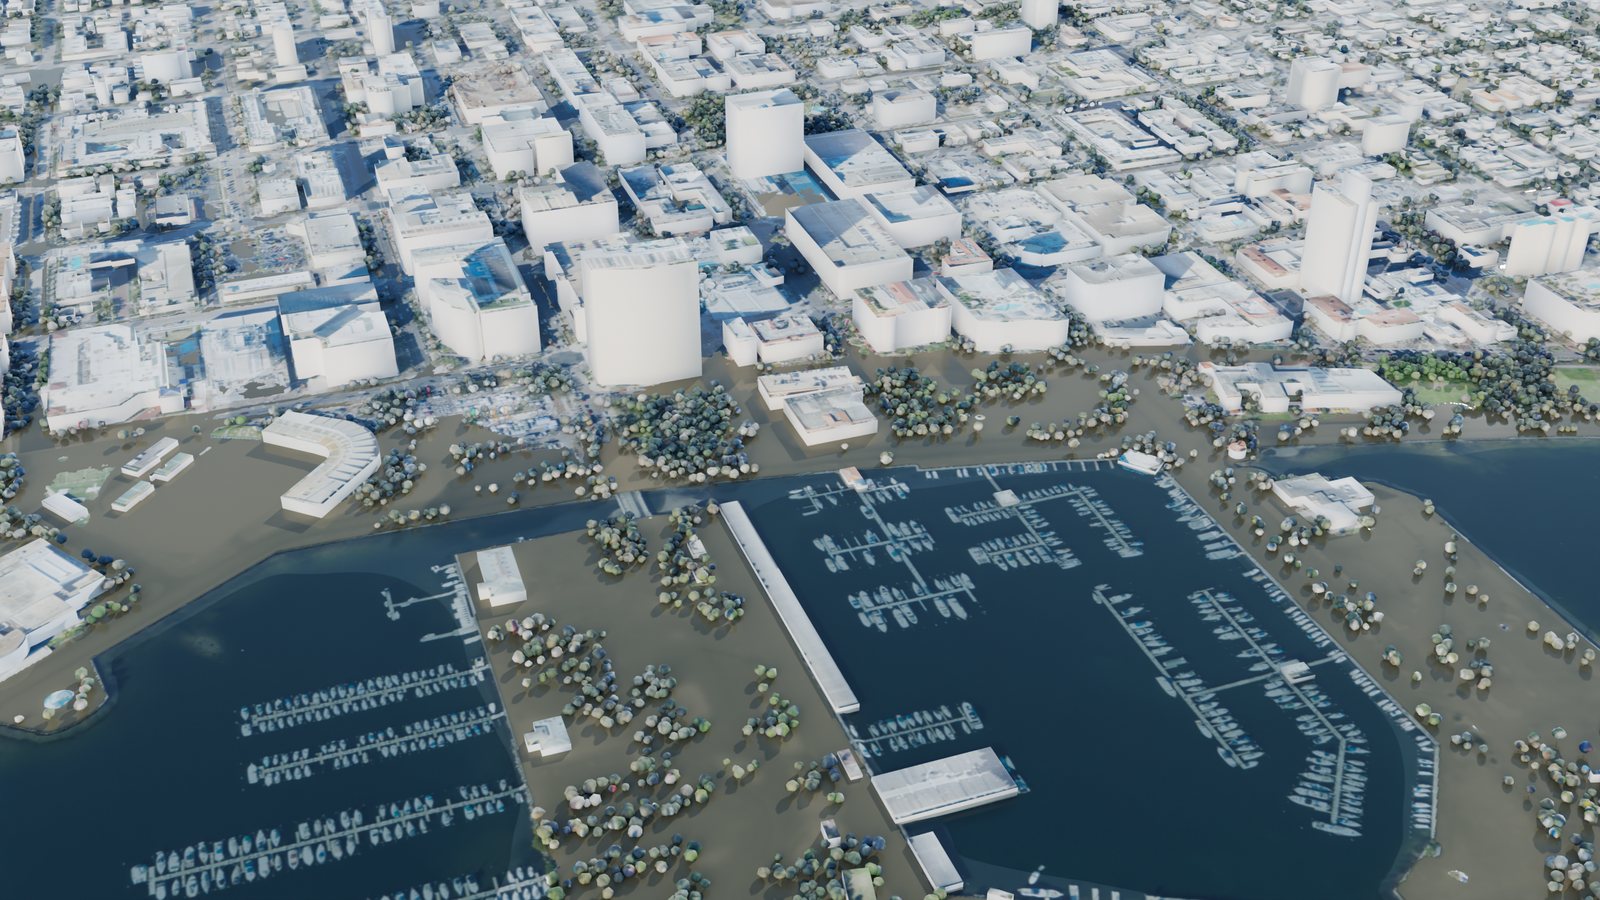
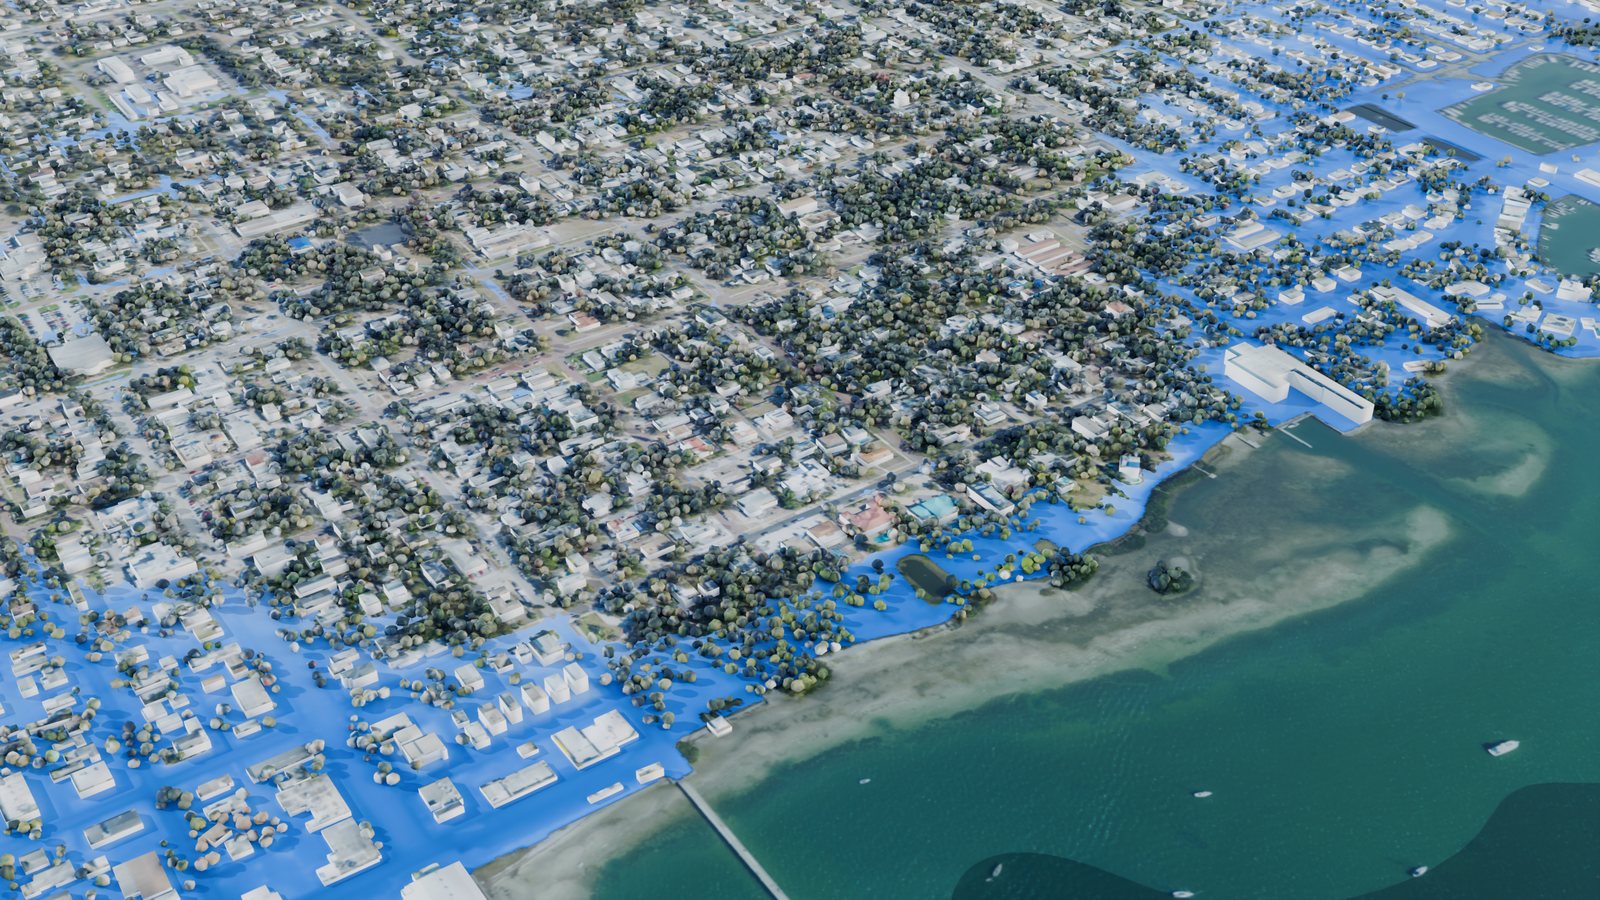
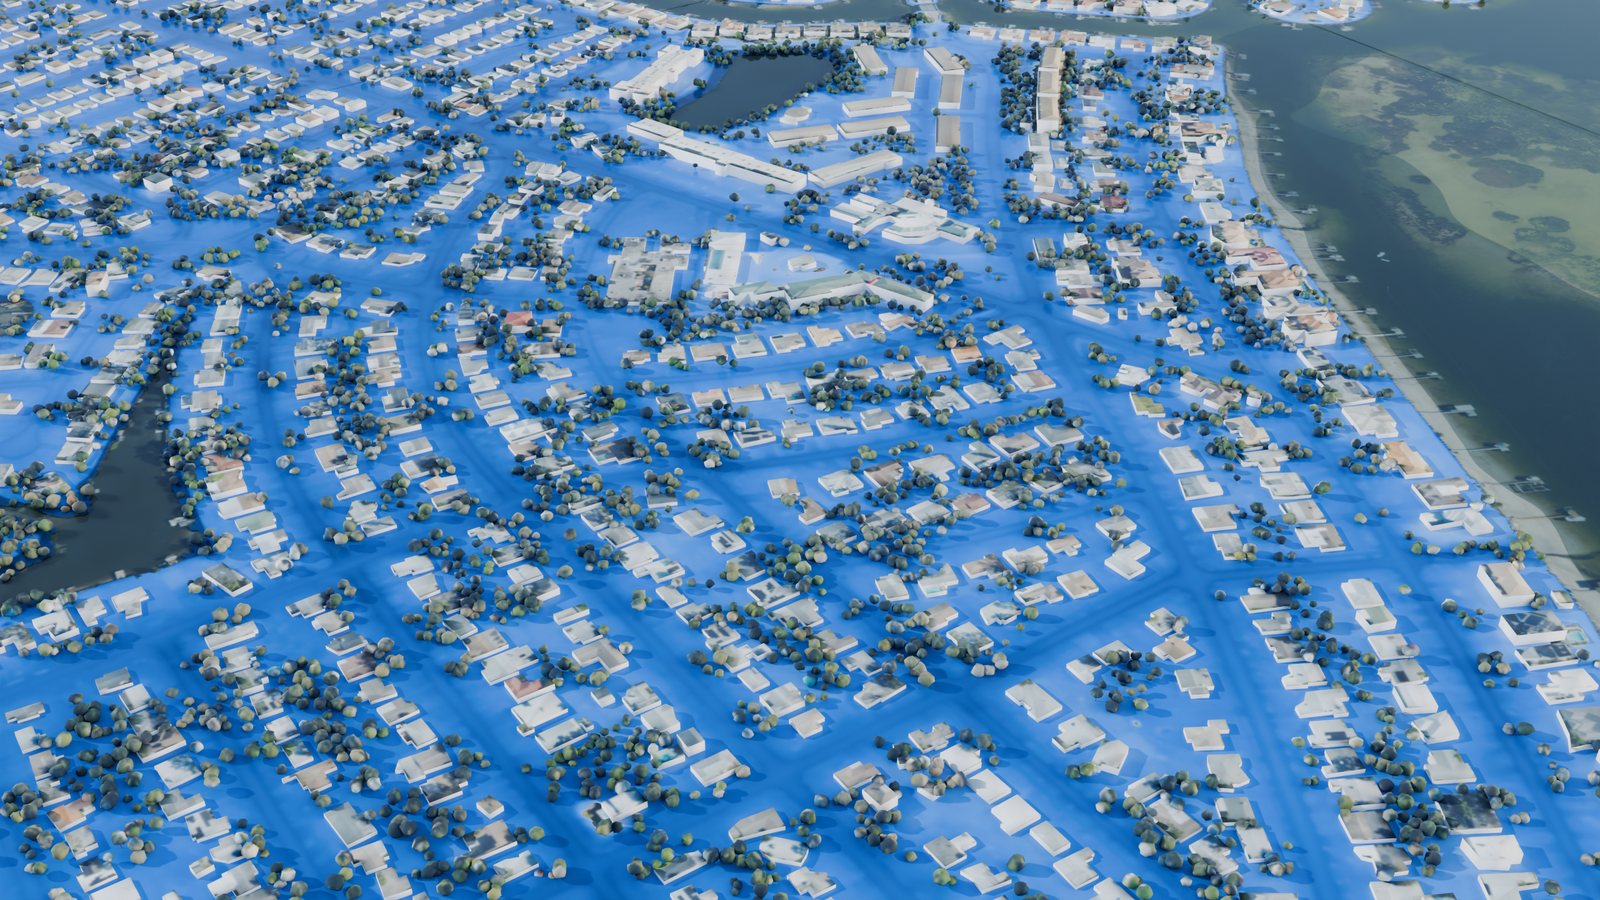
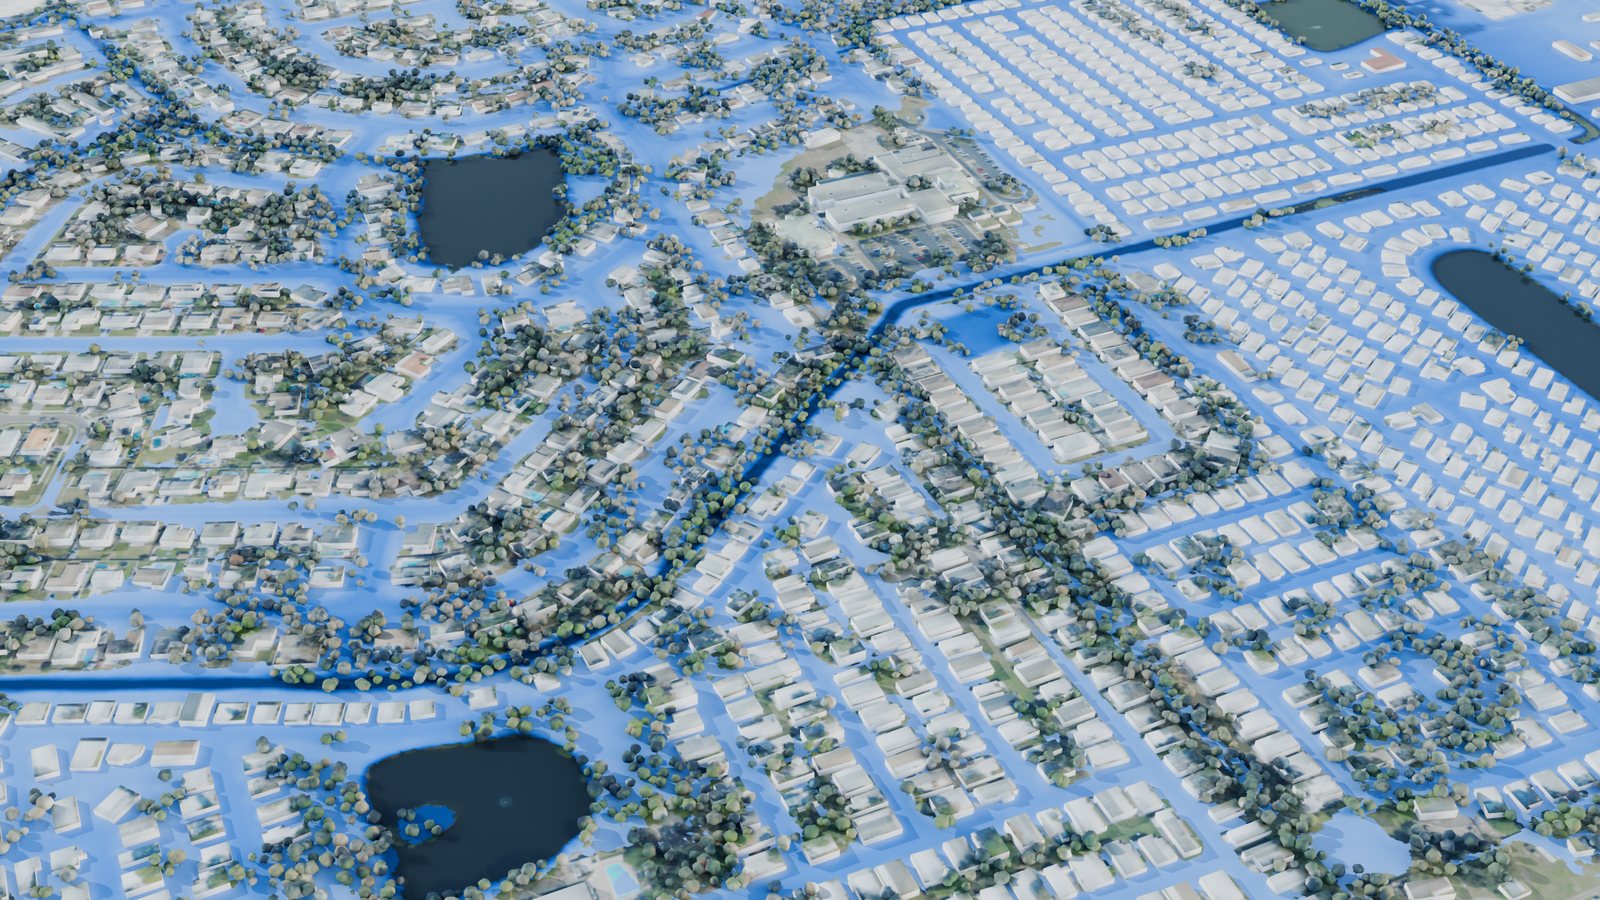
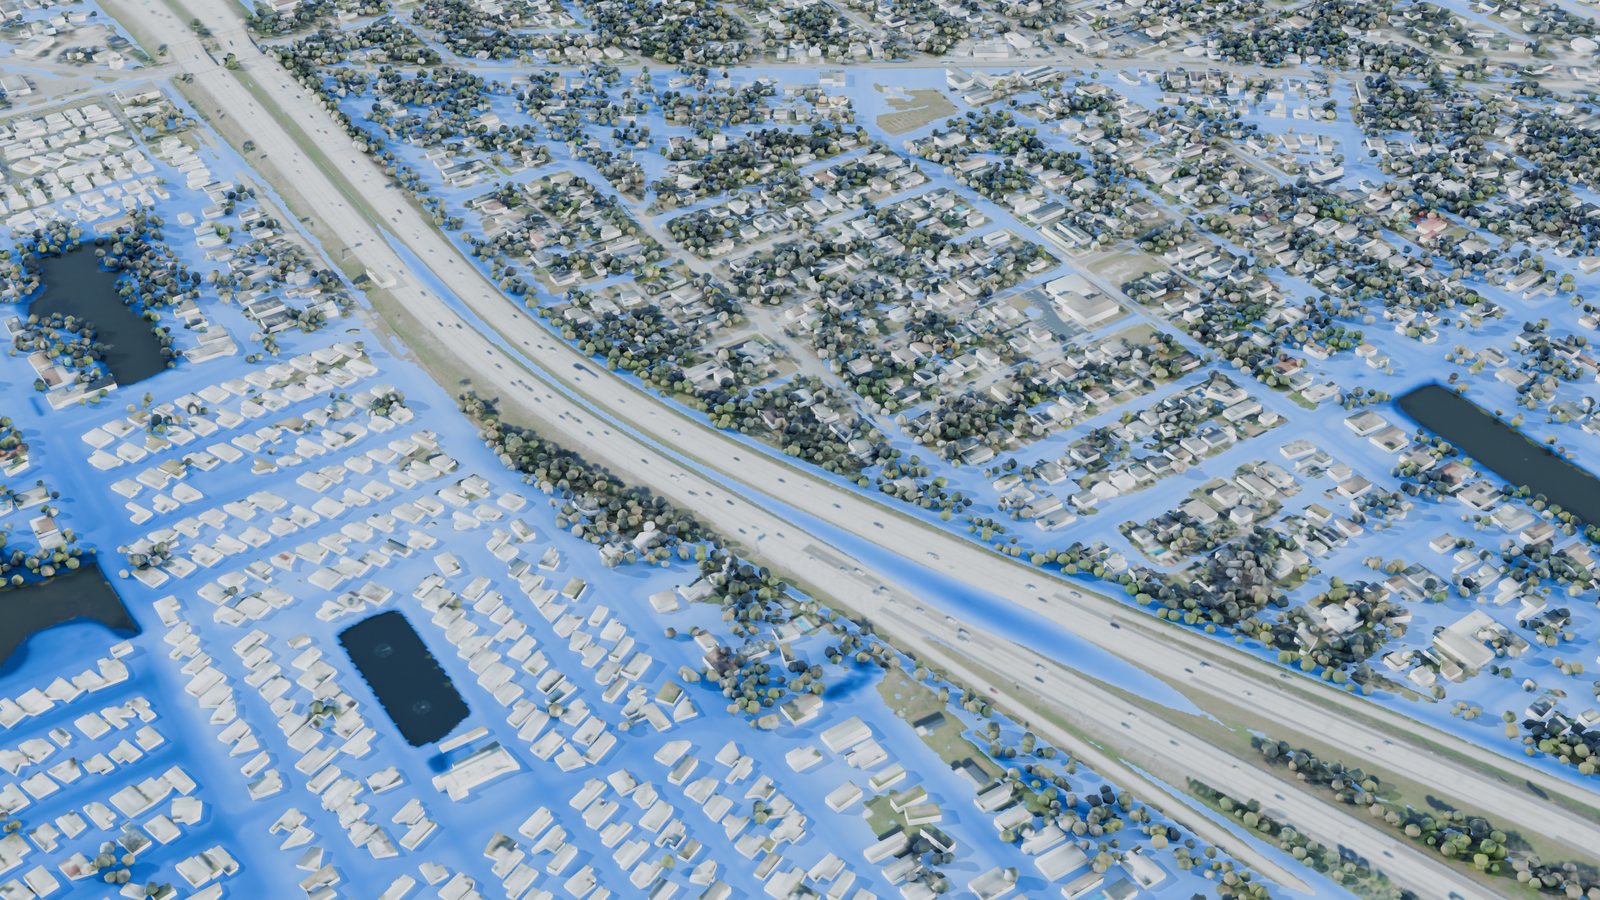
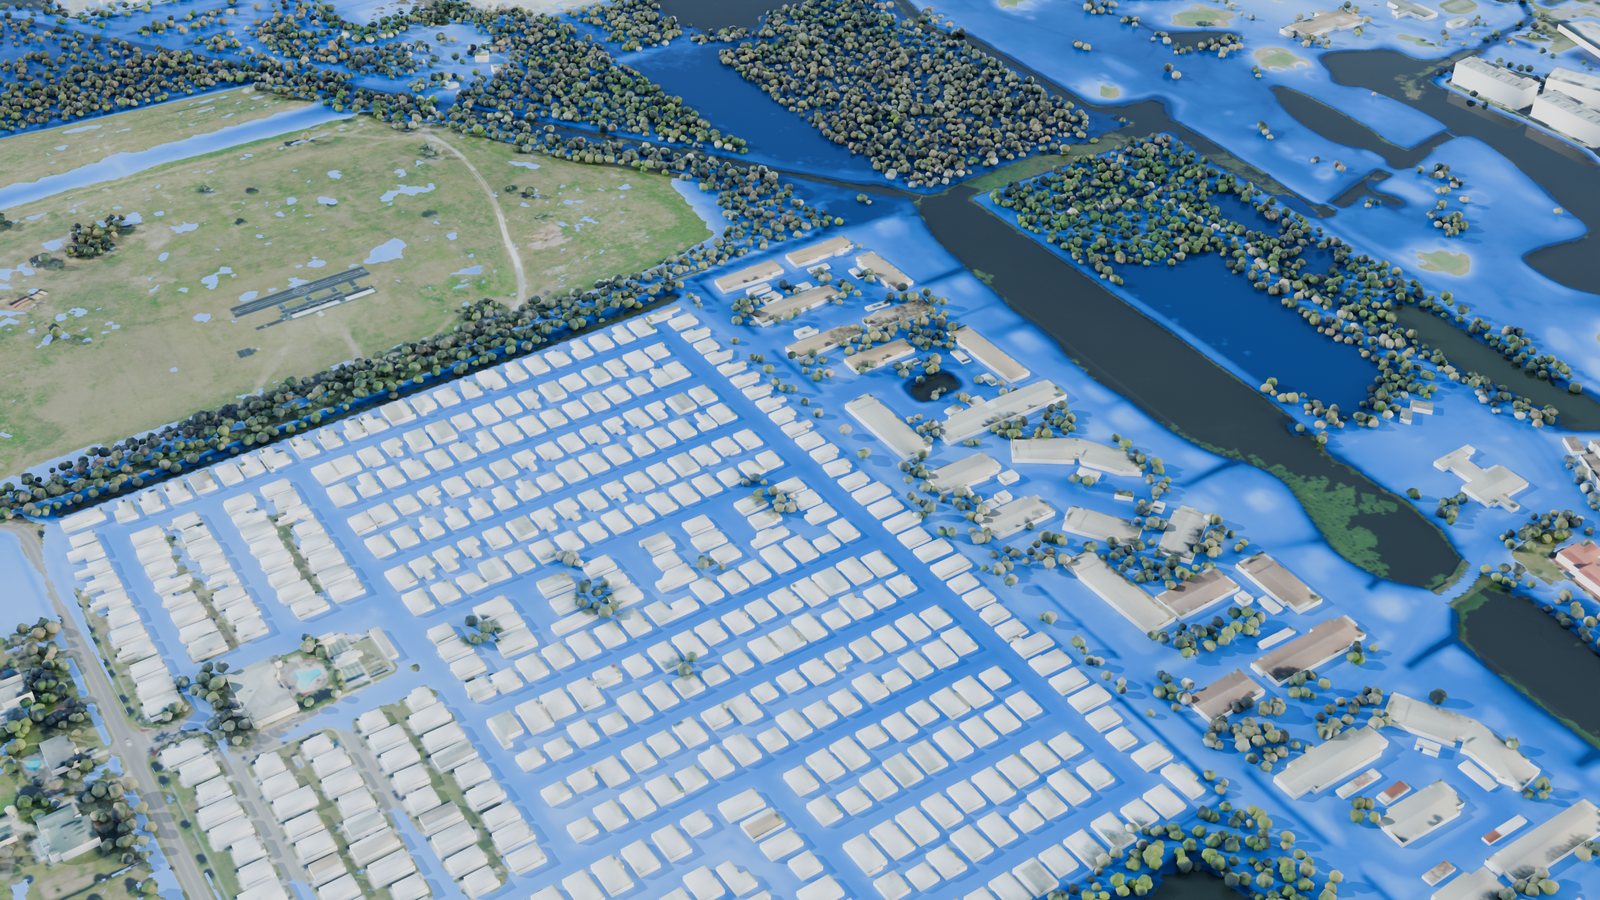
HeleneTreasure Island, 03:45 UTC: the Gulf over the beach and Gulf Boulevard, meeting Boca Ciega Bay behind.HeleneJohn’s Pass and Madeira Beach, flood depth on land in blue; the pass and the Gulf stay clear.HeleneDowntown St. Petersburg, 04:30 UTC: the waterfront parks and the streets behind the marina.HeleneGulfport on Boca Ciega Bay, 04:00 UTC.HeleneShore Acres in depth: the darkest streets held more than 1.5 m.MiltonCentral Largo, 05:30 UTC on 10 Oct: runoff collected among homes and mobile-home parks after the rain eased.MiltonLealman and Joe’s Creek, north St. Petersburg, 02:30 UTC.MiltonWest St. Petersburg near Cross Bayou, 02:30 UTC, in photo style.MiltonWest Largo by the Intracoastal Waterway, 06:30 UTC.
In motion
From the whole county to Treasure Island: the deepest water of Helene, with the island at its peak.Shore Acres from 23:30 UTC on 26 Sep to 07:30 UTC on 27 Sep: the surge comes over the seawalls, fills the streets, and drains back.Lealman from 18:00 UTC on 9 Oct to 08:00 UTC on 10 Oct: Milton’s rain gathers in the streets.
How it was made
The model
GeoSWE, a GPU shallow-water solver, on a 1 m grid of NAD83 / UTM 17N covering 31.5 × 61.3 km: 1.93 billion cells, 1.20 billion of them in the computed domain (land plus water within 500 m of it). Every building is a solid block at its mapped height, so water goes around it.
Both runs used 256 GPU dies on 32 nodes of the Frontier supercomputer at Oak Ridge: Helene’s 16 hours took 47 minutes (1.51 million time steps), Milton’s 20 hours took an hour (1.81 million).
The data
Ground: USGS 3DEP 1 m lidar; bay and Gulf floor: NOAA NCEI CUDEM.
Buildings: FEMA / ORNL USA Structures, 400,415 footprints with heights.
Land cover for friction and soaking: NOAA C-CAP 2021, 1 m.
Water levels: NOAA tide gauges at Clearwater Beach, St. Petersburg, Old Port Tampa and Port Manatee, imposed 500 m offshore; for Helene, the north Gulf coast is scaled to a USGS high-water mark at Fred Howard Park (2.76 m).
Rain: NOAA MRMS radar every 15 minutes, matched to its gauge-corrected hourly totals.
Pictures: USDA NAIP 2023 aerial photos, 30 cm.
What it leaves out
Waves and wind setup inside the bays; the surge comes only from the gauge records at the edge.
The storm-drain network: paved ground loses 4 mm/h and soil soaks up a set rate by land cover, so Milton’s shallow ponding is likely too wide.
Water inside buildings, floor heights, and flow under raised houses; docks and boathouses over water were left out of the flow.
The grid ends 2 km short of the Pasco line; figures are for Pinellas County only.
This is a research hindcast, not an official flood product.